In our discussions last month about entropy, we introduced the term “arrow of time”.
https://convex-strategies.com/2023/08/15/risk-update-july-2023-it-will-not-work/
“Like with all things that live in non-ergodic, path dependent space, time dependence matters. Something that may be a low probability in a limited specified time horizon, is a certainty over the course of unbounded time.”
“This goes back to the concept of Self-Organized Criticality, aka Sand Pile Theory. The low entropy accumulating pile of sand only appears stable. It wants to transition to its high entropy state, the post avalanche equilibrium of disorder as the sand chaotically spreads out across the table. To paraphrase the video, there is a clear difference between going to the past and the future and that difference is entropy. ‘An arrow of time.’”
The concept of an arrow of time was introduced by renowned physicist, Arthur Eddington. Most simply put, it is the concept that time moves only in one direction, that time is asymmetrical.
“Let us draw an arrow arbitrarily. If as we follow the arrow we find more and more of the random element in the state of the world, then the arrow is pointing towards the future; if the random element decreases the arrow points towards the past. That is the only distinction known to physics. This follows at once if our fundamental contention is admitted that the introduction of randomness is the only thing which cannot be undone. I shall use the phrase ‘time’s arrow’ to express this one-way property of time which has no analogue in space.”
Arthur Eddington. “The Nature of the Physical World”, 1928.
We can’t help but note the similarity in book titles with our oft referenced tome on Self-Organized Criticality, by Per Bak, “How Nature Works”. Indeed, the concept of time pervades virtually all of our work and thinking. Our clearly stated raison d’être is to improve capital compounding for end capital owners, at its very core an activity defined as taking place through time. We laid out, about as clearly as we could, the relevance of convexity to the non-ergodic path of compounding in our June 2023 Update – “One Thing”.
https://convex-strategies.com/2023/07/13/risk-update-june-2023-one-thing/
“The end capital owner isn’t concerned about annual arithmetic returns. It is geometric compounding, through time, that will achieve the desired terminal wealth. Without strongly convex risk protection, you aren’t cutting off the devastating negative compound events and will forever under-participate in the upside.”
Our core criticism of what we term “Sharpe World”, the generally accepted theories of finance and economics that today’s world operates under, is the disregard of time. All the while the status quo is explained and justified by the respective actors, the actual imbalances and ‘sandpile’ of risk build through time, with ever greater implications for owners of capital.
Ergodicity is another field that we frequently reference that elucidates the misapplication of time. Ole Peters is pretty much the father of Ergodicity Economics and publishes regular blog notes on the topic that make for great reading. He wrote one back in 2018 that goes back to the very beginning of the evolution of Sharpe World methodologies, noting the time-related flaws in work done by Daniel Bernoulli, work that is at the very core of much of the Nobel Prize winning mathematics that the financial world functions under to this day.
“The problem is treated in an a-temporal space, as a so-called ‘one-shot game’. The mathematics is the mathematics of things happening in parallel universes, not of things happening over time.”
Ole Peters, 2018.
https://ergodicityeconomics.com/2018/02/16/the-trouble-with-bernoulli-1738/
We highly recommend following Ole’s work. His latest piece, “Insurance as an ergodicity problem”, is a great read and tracks in line with the examples of adding portfolio insurance to an investment portfolio that we showed back in our July 2021 Update, “Transitory gets the Orwell Treatment”.
https://convex-strategies.com/2021/08/20/risk-update-july-2021/
Ole puts it very clearly, stressing the relevance of time: “The first thing we notice is that over time, the expected wealth is an unachievable fiction for all agents. Next, we see the main result, namely that when the risk is high, in the long run, the 2 agents who judge insurance by time-average growth and often set up contracts exponentially outperform the 2 agents who judge insurance by expected wealth and always reject it, despite the identical loss fraction and loss probability in both groups.”
As we like to say, “it’s just math”. The denominator, ie risk, is more important than the numerator in the path to superior compounding. Put better brakes on your race car so that you can, safely, drive faster; not just for one lap of the race, but for lap after lap after lap. Convexity = Compounding. Please, if you have not already done so, try to read the above linked June 2023 Update, “One Thing”.
“An ounce of prevention is worth a pound of cure.” Benjamin Franklin, circa 1736.
Sadly, as wise as Ben was, his premise may not be all that popular in a practice that makes a living out of selling cures. For this month’s note, we want to focus on the relevance of the ‘Arrow of Time’ in the world of accumulating economic and market imbalances.
In our February 2022 Update, “The Road to Serfdom & Pascal’s Wager”, we led off with this Hayek classic:
“We are ready to accept almost any explanation of the present crisis of our civilization except one: that the present state of the world may be the result of genuine error on our own part and that the pursuit of some of our most cherished ideals has apparently produced results utterly different from those which we expected.” Friedrich A. von Hayek, “The Road to Serfdom”.
https://convex-strategies.com/2022/03/18/risk-update-february-2022/
As a very simple visual of where a well-intended ideal could lead to less-than-desired outcomes, we like to show this beauty. Sort of a “how do you get to a Minsky Moment” case study.
Figure 1: UK 20yr Historical Blocks of CPI Mean and Volatility

Source: https://personal.lse.ac.uk/reisr/papers/22-whypi.pdf /Millenium dataset of the Bank of England, Convex Strategies
It has become kind of a tradition here at this time of the year to update readers on the back of the Kansas City Federal Reserve’s Jackson Hole event. It often gives a very good insight into the spin/narrative that the keepers of the Ivory Tower want to push out into the public square. This year did not disappoint. In 2021 Fed Chair Jerome Powell set the tone with the narrative that, as they liked to call it, inflation was transitory. Then again, in 2022, Chair Powell led the way with the full 180-degree reversal to restoring price stability at any cost – “Without price stability, the economy does not work for anyone.”
You can see our thorough breakdowns of those two events as follows:
https://convex-strategies.com/2021/09/22/risk-update-august-2021/
https://convex-strategies.com/2022/09/16/risk-update-august-2022/
This year, however, Chair Powell underwhelmed, going with a very mechanical/technical Fed-speak presentation, “Inflation: Progress and the Path Ahead”. We link it here, but it is hardly worth reading.
https://www.federalreserve.gov/newsevents/speech/powell20230825a.htm
The far more interesting speech this year was given by ECB President, Christine Lagarde – “Policymaking in an age of shifts and breaks”. This one is definitely worth a read. It is almost a mea culpa, admitting that they didn’t do a good job, yet still adheres to the principle that Hayek implies above, the current situation has nothing to do with their past actions. She is, however, explicit that there has been a change in ECB functioning.
https://www.ecb.europa.eu/press/key/date/2023/html/ecb.sp230825~77711105fe.en.html
“We will instead have to construct policy frameworks that capture the complexity we face and provide a hedge against it – something central banks are already starting to do. In the ECB’s case, we have made our future decisions contingent on three criteria: the inflation outlook, the dynamics of underlying inflation and the strength of monetary policy transmission.”
Begs the question as to what they were doing before, but we suppose progress is progress. Ms. Lagarde even mentions one of our frequent discussion points; credibility.
“If we are to maintain our credibility with the public, we will need to talk about the future in a way that better captures the uncertainty we face.”
Before anybody starts to believe that the ECB has changed their stripes and have taken our years of constructive criticism to heart, we suggest you first read Ms. Lagarde’s subsequent speech, “Communication and monetary policy”. We may be cynical, but it strikes us that they are not taking her comments about humility in the Jackson Hole speech, and again in this speech, particularly to heart.
https://www.ecb.europa.eu/press/key/date/2023/html/ecb.sp230904_2~f2d3ee13d9.en.html
“Communication plays a crucial role in influencing people’s inflation expectations.”
It looks a little bit to us as though their efforts of ‘misdirection’ through their communications haven’t been through any particularly relevant evolution. Ms. Lagarde continued:
“While inflation is now falling, effective communication is likely to remain as paramount importance even after the current spike is over.”
Is inflation falling? Is it merely a current spike?
Figure 2: Eurozone HICP Index 1996-Aug2023 (white). 17.78% Rise since Mar2021 (red)

Source: Bloomberg, Convex Strategies
With the Arrow of Time in mind, history clearly matters with respect to the above line.
Moving on from the two keynote central bank leaders at Jackson Hole, we would highlight a very clear theme around the academic papers that were presented and discussed at the event. It is the theme that we have been focusing on quite explicitly for some years now. We usually refer to it as “who’s gonna own the 40?”. The ‘40’ refers to the fixed income holdings in the Sharpe World investment standard 60/40 balanced portfolio but used by us to represent the entirety of the undercapitalized risk that Sharpe World practices have embedded in the global financial system to get, primarily regulated fiduciaries, to absorb the ever-expanding mass of government debt.
We used this wonderful chart from Gerard Minack back in our December 2020 Update, “Inflation is upon us; 60/40 is dead”. https://convex-strategies.com/2021/01/22/risk-update-december-2020/
We put it this way at the time: “In the Minack piece, he discusses the linkage between historically high equity valuations and low interest rates. We might argue that the bigger takeaway from his lovely picture is that there is no upside in holding fixed income securities and, even more obvious, one is not a risk mitigant for the other.”
Figure 3: The Golden Era of the Balanced Portfolio. Dec2020

Source: Datastream, Shiller, GFD, Standard&Poors, BLS; Minack Advisors
We’ve taken the liberty of updating this, to the best of our ability (we don’t have data going back to 1925!) and have taken to showing the updated one as a quick and simple visual to explain what has happened with markets since interest rates bottomed out in late 2020.
Figure 4: Departing the Golden Era of the Balanced Portfolio. Recreated 1962-July2023

Source: Bloomberg, Convex Strategies
Readers can check out all of the Jackson Hole discussed papers here: https://www.kansascityfed.org/research/jackson-hole-economic-symposium/jackson-hole-economic-policy-symposium-structural-shifts-in-the-global-economy/.
The papers that we would particularly highlight, along the above theme, are the one from Darrell Duffie, “Resilience redux in the US Treasury market” and the one from Barry Eichengreen, “Living with High Public Debt”. We had the good fortune to sit in on a pre-presentation of Professor Duffie’s paper, here in Singapore, just a couple of months back.
https://www.kansascityfed.org/Jackson%20Hole/documents/9743/Duffie-handout.pdf
“In this paper, I describe new empirical evidence, with supporting theory, that the current intermediation capacity of the US Treasury market impairs its resilience. The risks include losses of market efficiency, higher costs for financing US deficits, potential losses of financial stability, and reduced save-haven (sic} services.”
“Our thesis in this paper is that high public debts are not going to decline significantly for the foreseeable future. Countries are going to have to live with this new reality as a semi-permanent state of affairs. These are not normative statements of what is desirable; they are positive statements of what is likely.”
We would simply ask again, who’s gonna own the 40? We expanded on these sorts of issues in quite some detail a year ago in our September 2022 Update, “Is Sharpe World Closing?”. This is a must read for those wanting to understand the challenges that were at the core of the commissioned papers for this year’s Jackson Hole event.
https://convex-strategies.com/2022/10/18/risk-update-september-2022-is-sharpe-world-closing/
In more official sounding economic-speak, we put it this way in a recent conversation: “Fiscal dominance and financial repression are the themes of our times.”
Indeed, “fiscal dominance” has become an ever more common catchphrase of late. In particular, we would draw any reader’s attention to this wonderful piece by economist Charles Calomiris, “Fiscal Dominance and the Return of Zero-Interest Bank Reserve Requirements”, that recently was published by the St. Louis Fed.
“Fiscal dominance refers to the possibility that the accumulation of government debt and continuing government deficits can produce increases in inflation that “dominate” central bank intentions to keep inflation low.”
This is a really good read. The paper stresses that in the current environment of unsustainable fiscal debt and deficits it is likely that the system will have imposed upon it a combination of financial repression, eg. banks forced to hold zero-interest reserves, as well as a “inflation tax”, ie. government attempting to surprise the markets by creating unanticipated inflation.
“As the result of the high current US government debt-to-GDP ratio and continuing projected deficits, we face a possible dollar inflation uncertainty nightmare. Continuing deficits, if unchecked, eventually will lead to a fiscal dominance problem.”
“If the bond market does not anticipate a fiscal dominance shock sufficiently far in advance (where the definition of “sufficiently far” is determined by the duration of the bonds held by the public), then the bond investors would be caught with losses on high-duration bonds.”
This line of thinking all but perfectly parallels our discussions as to whether Sharpe World is closing. To remind readers, we posed that as a two-forked question. Is it closing because end capital holders were all going to flee the regulated institutions that have been duped into holding these bonds? Or are the powers-that-be going to close the gates of Sharpe World, aka financial repression, so nobody can get out?
The funny thing about this particular paper is that he writes it from the perspective of what could happen. Seemingly unaware that it is precisely what has already happened! Fiscal dominance and financial repression are exactly what have got us to this point. We have already come through an extended period of massive bank reserves being held at 0% interest, supporting sovereign debt held as 0% RWAs, as central banks bought up the bulk of net issuance, while governments blew through 100% debt/GDP ratios. From the above linked Eichengreen paper, take a look at Italian fiscal dominance for the last 9 years.
Figure 5: Italy; Cumulative Net Purchases of General Government Debt by Investor Type

Source: Kansas City Fed Jackson Hole Symposium, 2023.
ZIRP, NIRP, QE, YCC are all simple forms of financial repression when combined with Basel III, Solvency 2, IAS19 and the rest of the Sharpe World based regulatory risk and accounting constructs to get financial fiduciaries to own government debt with other people’s money.
Equally as obvious as having already been done is the “unanticipated inflation shock”. What do you think we have just been through?
Figure 6: US CPI Index (white) and 2% Trendline (red). Sept1971-July2023

Source: Bloomberg, Convex Strategies
To his credit, Calomiris does point this out in the paper, noting that US Treasury bondholders have already taken a significant hit, “mainly as a result of inflation surprises since 2021.” Frighteningly, he is clear that we need to be on the look-out for more of this, basically indefinitely, going forward.
Our view remains the same. The largest uncapitalized risk in the system revolves around this issue of fiscal dominance and financial repression. In the regulatory mathematics of Sharpe World, government debt holding exists somewhere in a spectrum between riskless (eg. 0% RWAs on bank balances sheets) and risk-reducing (eg. LDI Pension investment schemes). Rising back-end interest rates, in debt markets defined by fiscal dominance and financial repression, would appear to us to be the ultimate global fragility in the system.
We posed the question back in our April 2022 Update, “How did they expect it would end up?”, “what will it look like when the long-term trend of lower interest rates finally reverses?” We produced this chart of what we thought likely answered that question.
Figure 7: 10yr Bond Yields: US (white), UK (yellow), Germany (purple), Australia (blue), Korea (papaya), Japan (light blue). Jan2000-Apr2022

Source: Bloomberg, Convex Strategies
Despite all the interim talk of recessions and pivots, the up-to-date version still seems to indicate the same thing.
Figure 8: 10yr Bond Yields: US (white), UK (yellow), Germany (purple), Australia (blue), Korea (papaya), Japan (light blue). Jan2000-Aug2023

Source: Bloomberg, Convex Strategies
Before moving on to our next imbalance, quite obviously indicated in the above chart as being Japan, we will let our Poet Laureate of Economics, Bill White, sum it up for us.
https://www.ineteconomics.org/uploads/papers/WP_210-White-Monetary-Policy.pdf
“Perhaps the most effective way of showing the need for fundamental monetary reform is to point out the negative implications of the monetary policies followed by the major central banks in the advanced economies over the last few decades.
First, the general adoption of a positive (+2%) inflation target has prevented the downward adjustment or prices that would be the natural product of increases in productivity and positive supply shocks. Second, the recurrent use of monetary easing to spur demand and raise inflation has become increasingly ineffective. Current monetary policy faces a fundamental problem of temporal inconsistency: solving today’s problems also makes tomorrow’s problems worse. Third, stimulative monetary policy has had a variety of unintended and unwelcome consequences that can only worsen; credit “booms and busts”, potential financial instability, fiscal unsustainability, a progressive loss of central bank “independence”, growing inequality of wealth and opportunity and a slower growth rate of potential output. Fourth, as the threat posed by these unintended problems have cumulated over time, “exit” and the “renormalization” of policy has become ever harder to achieve.
To sum up, the current monetary system has trapped us on a path we do not wish to follow because it leads inevitably to ever bigger problems.” William White.
No reason for us to write it when Bill says it so well.
Returning to Japan then, readers will know that we have written extensively about the country over recent years, even having titled our March 2022 Update, that went into it in some detail, “The most dangerous peg in the world”.
https://convex-strategies.com/2022/04/26/risk-update-march-2022/
“No central bank has been in the low rates world as long, nor on the relative scale, as the BOJ. The Japanese Yen (JPY) is the original low yielding funding currency in the world of carry trades. Japan is the birthplace of the structured product world, the fine art of creating the impression of enhanced yield by embedding toxic non-linear short volatility risk. Decades of low rates and unprecedented volatility suppression has made Japan related volatility one of the best “tail-risk” hedges out there, across systemic risk events, over most of the last several cycle ends, whether that be in currency, equity, or credit related structures. The one thing, however, that has sustained, has been their ability to keep interest rates heading lower, then staying low, and eventually pegging the 10yr JGB yield at 0% since 2016.”
Our observations around Japan have hardly wavered, as they try to navigate the tricky path of pulling back some of the monetary excess, they have for so long showered upon the world. We updated in detail the current state of play just last month in our July 2023 Update, “IT WILL NOT WORK!”. Again, very much worth a read, we think, if you haven’t already.
https://convex-strategies.com/2023/08/15/risk-update-july-2023-it-will-not-work/
“We keep asking them the same question, the same question we’ve been posing to all central banks since the advent of QE and ZIRP, “What if it works?”. In the case of Japan, we posed that question to them in early 2022, namely what if your inflation measure goes from 0% to 1% and $/JPY from 105 to 115? Then to 2% and 125? Then to 3% and 135? Then to 4% and 145? Most recently, we updated it to 5% and 155? Then 6% and 165? As readers have heard us say so many times before, they have consistently laid out their arguments, bolstered by strong beliefs for both overseas and at home, for imminent reversals of inflationary trends, in the face of still accommodative policy extremes, that IT WILL NOT WORK!”
Updating our two factor “is it working” chart, and we get the following:
Figure 9: Japan CPI ex-Fresh Foods and Energy yoy% (white). $/JPY FX Rate (orange). JGB 2yr Yield (blue)

Source: Bloomberg, Convex Strategies
Not surprisingly, the global challenge of “who’s gonna own the 40?”, over the month of August, is likely only adding to the pressures in Japan.
Figure 10: JGB 10y Yield (white). 10y Swap Rates: JPY (blue), USD (orange), EUR (purple). YCC Ceilings: Old 0.25% (red dash), Flexible 0.50% (green dash), Hard 1.00% (yellow dash)

Source: Bloomberg, Convex Strategies
Japan’s all-out efforts to keep interest rates low, despite the domestic and global rises of price indices, has led to the logical outcome, an ever-weaker JPY. This leads us to our next arrow of time imbalance: China.
Most market participants are now aware of the challenges facing the Chinese economy and markets. We wrote about them at length back in our May 2020 Update, “China & HK = Fragility”.
https://convex-strategies.com/2020/06/17/risk-update-may-2020/
A quick update to one of our proxies of fragility, China’s FX Reserves as proportion of their M2 Money supply, looks like this:
Figure 11: China FX Reserves/M2 Money Supply

Source: Bloomberg, Convex Strategies
Our interpretation of figure 11 is that their massive FX Reserves pale in comparison to the amount of domestic money that has been created over the past 15 years.
The People’s Bank of China (PBOC) still maintains tight controls over the domestic currency, the CNY in market parlance. They still impose quite stringent capital controls and tightly manage the currency’s value with a mechanistic daily fixing against a basket of global currencies. A unique feature of the Chinese FX markets is the existence of an active, liquid, offshore market for what is termed CNH that trades freely outside of the capital control constraints of the onshore CNY market. The onshore and offshore markets are held closely together by sufficient osmosis through the regulatory barrier and the ability of specifically designated Chinese banks, most particularly Bank of China in HK, to act as defacto lenders-of-last-resort in respective offshore CNH markets.
While in today’s world the CNY is technically managed against the PBOC’s basket, it is most widely traded against the USD and it is the USD daily fixing by the PBOC that sets where each new day’s trading, within the allowed fluctuation band, commences. The long history of USD/CNY shows a mix of long periods of hard pegs, a number of sharp devaluations, periods of managed appreciation and, since the August 2015 devaluation and transitioning to the current basket mechanism, a period of higher volatility but within a managed range.
Figure 12: USD/CNY 1980-2023

Source: Bloomberg
The glaring observation that is piquing our attention of late is the extended period, similar to what we saw around this time last year, of a strikingly strong CNY bias to the PBOC’s fixes over recent weeks. We can track this using Bloomberg data on the projected fixing per Bloomberg’s estimate of the fixing model versus the daily fix against the USD. This chart shows the divergences, the blue bars being relative strength of the CNY in the fix versus what was implied that day by the model. In recent days we have seen a string of all-time strong Counter Cyclical Factors (CCF) applied to the fixing (this is what PBOC calls their fudge-factor for ignoring the mechanistic model outcomes).
Figure 13: PBOC Fixing Bias. Bloomberg Fix Estimate (FCCNYFIX Index) minus PBOC Midrate (CNYMUSD Index)

Source: Bloomberg
As we hinted above, it is not unreasonable to think that the USD/JPY strength is somehow contributing to this issue.
Figure 14: USD/CNY Fix Midrate (blue). USD/CNY Forecast Survey (white). USD/JPY (papaya-LHS)

Source: Bloomberg
Looking at past historical extremes of the CNH/JPY cross does give some indication that there might be something about levels above 20.00 that triggers some sort of policy response, by one side or the other. Maybe it’s just a coincidence.
Figure 15: CNH/JPY FX Rate and Historical Policy Responses

Source: Bloomberg, Convex Strategies
To date, we’ve seen the above noted fixing bias. We’ve seen bouts of verbal and explicit intervention. In addition, we will likely see changing of margin requirements, tightening of niggly little aspects of capital controls, funding squeezes on the offshore CNH market, all the little things that central banks do to combat undesired speculation and capital outflows. Throughout the month of August we have, de facto, seen a discarding of the basket-model and a virtual pegging against the USD, or at least an indication that the USD mid-rate won’t be tolerated much above the 7.20 level.
As we have noted forever, the explosive growth of credit in China makes it a prime, maybe the prime, candidate of where future wildfires might burn hottest. The below snap of Total China Credit, in absolute and as a percent of GDP, is like a poster child for fragility. Growing debt, by this measure, from CNY50tn to CNY436tn, is not a small experiment in a centrally planned economy.
Figure 16: Total China Debt (blue) and as % of GDP (white)

Source: Bloomberg
Updating our China debt to Global GDP chart from the April 2020 Update and scaling the growth rates to the most recent 5yr annual rate of growth, looks as follows:
Figure 17: Total China Debt vs Global GDP
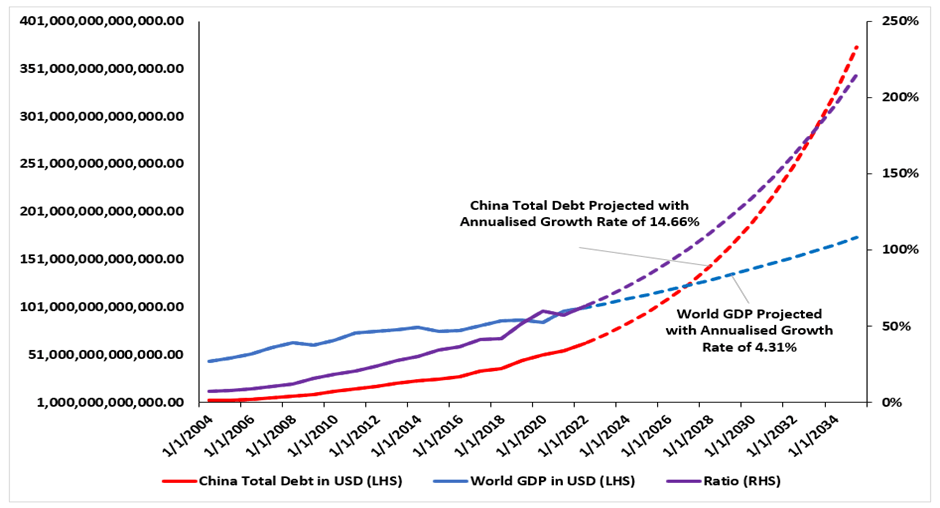
Source: Bloomberg, Convex Strategies
Pretty good news. At the slowed down pace of China credit growth, 14.66% down from our previous 16.75%, and the pickup of Global GDP growth, 4.31% up from our previous 3.6%, our projected crossover of China Debt/Global GDP of 100% has pushed out to 2027 from the previous 2025!
Talk about an Arrow of Time.
We don’t have the greatest confidence in central planners, even the ideologically superior ones occupying the Politburo in China. Time flows in one direction and entropy expands. You can plan all you want, sandpiles will do what sandpiles do.
“It turns out, strategic planning is just superstitious babble.” Nassim Taleb, “Antifragile”.
Read our Disclaimer by clicking here