It was a busy cycle for policymakers to close out the month. The Federal Reserve raised their Fed Funds target another 25bp, from 5.25% to 5.50%, and reiterated their commitment to battling inflation.
“Inflation remains elevated.”
“The Committee is strongly committed to returning inflation to its 2 percent objective.”
https://www.federalreserve.gov/newsevents/pressreleases/monetary20230726a.htm
We got a similar vibe from the ECB who also hiked rates by 25bp.
“Inflation continues to decline but is still expected to remain too high for too long.”
“The Governing Council’s future decisions will ensure that the key ECB interest rates will be set at sufficiently restrictive levels for as long as necessary to achieve a timely return of inflation to the 2% medium-term target.”
https://www.ecb.europa.eu/press/pr/date/2023/html/ecb.mp230727~da80cfcf24.en.html
The Bank of England also played along and went with a 25bp hike.
“CPI inflation remains well above the 2% target.”
“The Committee continues to judge that risks around the modal inflation forecast are skewed to the upside, albeit by less than in May, reflecting the possibility that the second-round effects of external cost shocks on inflation in wages and domestic prices take longer to unwind than they did to emerge.”
https://www.bankofengland.co.uk/monetary-policy-summary-and-minutes/2023/august-2023
As ever, the exception to the current central banking cabal of inflation fighters is the Bank of Japan (BOJ). In what was one of the stranger policy announcements we have ever seen, the BOJ initially announced no change in policy, that they were maintaining both their Policy Rate at -0.10% as well as the 10yr JGB yield target at 0.0%. This was shortly followed by the announcement that they were adjusting Yield Curve Control (YCC). The adjusted YCC entails ‘flexible’ control of the yield at the still remaining upper end of the YCC band at 0.50% (the previous hard ceiling) and the insertion of a new hard ceiling at 1.00%. This allowed the 10yr JGB yield to pierce the 0.50% ceiling and start to search for the meaning of ‘flexible’ in the BOJ’s new lexicon.
Updating one of our regular views for the above noted adjustments from the major Developed Markets central banks give us the below.
Figure 1: Policy Rates: Fed (orange), ECB (purple), BOE (yellow), BOJ (blue). JGB 10y Yield (white)

Source: Bloomberg
Unlike the Fed, ECB and BOE, who all stressed their ongoing efforts to push their inflation measures back down to their respectively mandated price stability targets, the BOJ reiterated their policy settings targeted at pushing inflation still higher such that it exceeds their 2% target in a sustainable manner. Apparently, the 15 consecutive months that it has already exceeded 2% does not yet qualify as sustained.
Figure 2: Japan CPI ex-Fresh Food and Energy yoy% (white). CPI Core yoy% US (orange), Eurozone (purple), UK (yellow)

Source: Bloomberg
In line with Governor Ueda’s comments that we discussed last month, per his unspecified ‘underlying inflation’, it is worth noting the insertion of a new “accompanied by wage increases” in their stated target.
https://www.boj.or.jp/en/mopo/mpmdeci/mpr_2023/k230728a.pdf
“With extremely high uncertainties surrounding economies and financial markets at home and abroad, the Bank will patiently continue with monetary easing while nimbly responding to developments in economic activity and prices as well as financial conditions. By doing so, it will aim to achieve the price stability target of 2 percent in a sustainable and stable manner, accompanied by wage increases.”
“The Bank will continue with QQE with Yield Curve Control, aiming to achieve the price stability target, as long as it is necessary for maintaining that target in a stable manner. It will continue expanding the monetary base until the year-on-year rate of increase in the observed CPI (all items less fresh food) exceeds 2 percent and stays above the target in a stable manner. The Bank will continue to maintain the stability of financing, mainly of firms, and financial markets, and will not hesitate to take additional easing measures if necessary.”
(Italics are our emphasis)
They do give a nod to the effective strengthening of monetary easing through ever more negative real interest rates as prices continue to move upward.
“If upward movements in prices continue, the effects of monetary easing will strengthen through a decline in real interest rates…”
We have noted this point often. Their effective real rates are the most aggressively stimulative at any point in history. Meanwhile, their inflation measures are at 40yr highs.
Figure 3: Japan CPI ex-Fresh Food and Energy yoy% and JGB 2yr Yield (top panel) Real Interest Rate (lower panel)

Source: Bloomberg
We prefer to use the CPI ex-Fresh Food and Energy as it negates the impact of the circa 1% reduction in the y-o-y% change in both the Headline and Core measures from the imposition of the government’s fuel price subsidy earlier this year. We find it disappointing how often commentators, the BOJ included, fail to point out the impact of the February fuel price subsidy on those two indices and carry on as though nobody will notice.
The markets were initially a bit shellshocked (rates markets froze up for a good stretch immediately after the announcement) by the fumbling of the communication and then the confusion around the implications of the revised YCC functioning. Worth noting, the BOJ did the first Fixed Rate Operation since March, at the then 0.50% ceiling, in the morning before the meeting buying circa $6bn worth of 10yr JGBs. Fortunately, the kind folks at the BOJ had this handy visual aid all ready to go to explain everything clearly and succinctly, and the search for where the ‘flexibility’ would kick-in commenced.
https://www.boj.or.jp/en/mopo/mpmdeci/mpr_2023/mpr230728d.pdf
Figure 4: BOJ Revised Policy Infographic

Source: Bank of Japan
Yields quickly, if cautiously, spiked higher. We did find the first implications, on the following business day July 31st, of the meaning of ‘flexible’ as BOJ conducted an Unscheduled Rinban, purchasing a small $2bn worth of JGBs.
Figure 5: JGB 10y Yield (white) and JPY 10y Swap (blue). YCC Ceilings: Old 0.25% (red), Flexible 0.50% (green), Hard 1.00% (yellow)

Source: Bloomberg
To give some additional perspective, we can add 10yr Swap Rates for the USD and the EUR.
Figure 6: JGB 10y Yield (white). 10y Swap Rates: JPY (blue), USD (orange), EUR (purple). YCC Ceilings: Old 0.25% (red), Flexible 0.50% (green), Hard 1.00% (yellow)

Source: Bloomberg
To recap, the BOJ is sticking with NIRP, QQE, and YCC in order that some increasingly vague measure of inflation exceeds their 2% target in a sustainable manner. You can’t really question their commitment. Just like our real rate picture above, all things say, they are as aggressively loose as they have ever been.
Figure 7: JGB 2y Yield (white). USD/JPY FX Rate (magenta). Japan CPI ex-Fresh Food and Energy yoy% (blue). Japan GS Financial Conditions (green-inverted)

Source: Bloomberg
Figure 8: JGB 2y Yield vs Japan Taylor Rule Estimate

Source: Bloomberg
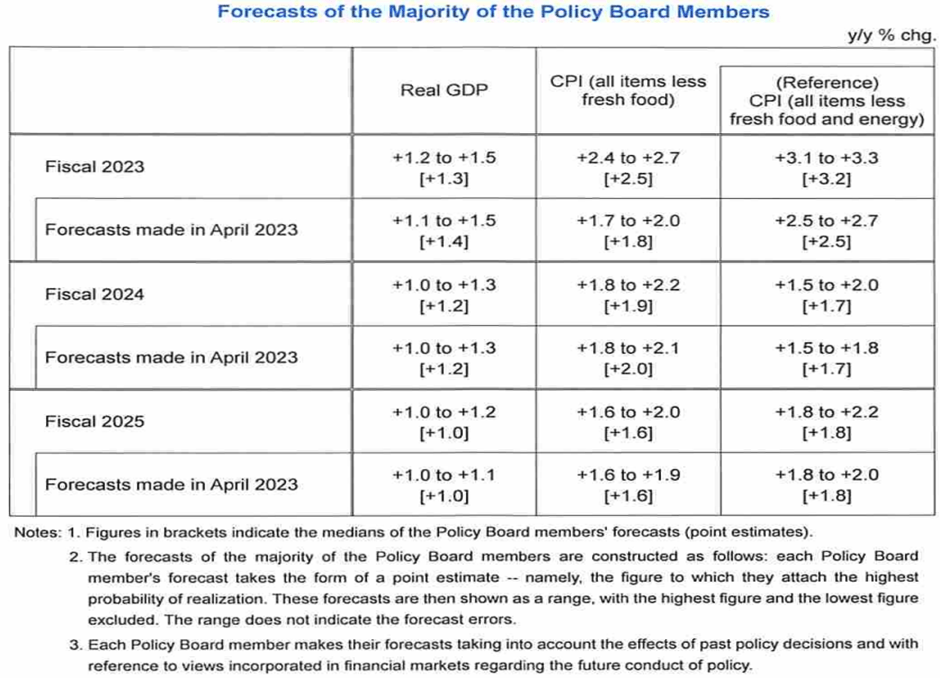
This brings us to the final act of BOJ’s little Kabuki drama of a policy meeting, that being the release of their quarterly “Outlook for Economic Activity and Prices”. Most significantly, we got revised forecasts for Fiscal Years 2023, 2024 and 2025. It is important to remember that the forecasts are for the average of the monthly year-on-year percent changes over the period. The FY’23 forecasts for both CPI ex-Fresh Food and CPI ex-Fresh Food and Energy were both revised upward by 0.7% from the previous forecasts in April. Again, we can’t help noting, that they make no mention of the impact of the February fuel price subsidy on the yoy% series for the CPI ex-Fresh Food numbers (terminological inexactitudes). Both series are now well above the 2% target for their respective FY’23 forecasts, 2.5% and 3.2% respectively. They both, however, return below the magical 2% number by FY’24 and proceed lower still for FY’25.
Focusing on the cleaner series, ex-Fresh Food and Energy, they have now revised up the FY’23 forecast 0.7% in each of the last two quarterly updates, bringing it from 1.8% as forecast in January to the current FY’23 forecast of 3.2%.
https://www.boj.or.jp/en/mopo/outlook/gor2307a.pdf
Figure 9: BOJ July 2023 Forecasts
Source: Bank of Japan
Figure 10: History of BOJ Quarterly Forecasts for CPI ex-Fresh Foods and Energy

Source: Bank of Japan
As the forecast is the average of the monthly reported yoy% change, we already have 3 months of the data series in hand and a pretty good idea (given the already reported July numbers for Tokyo) of a fourth month. This allows us to extrapolate what sort of numbers we would need to see for CPI ex-Fresh Food and Energy to track to the most recent forecast for FY’23 of 3.2%. We’ve plotted that on the below chart.
Figure 11: Japan CPI ex-Fresh Food and Energy (white) and Estimated Future Path to Achieve BOJ Forecast (multi-coloured)

Source: Bloomberg, Convex Strategies
BOJ is stating it loud and clear. Despite 40yr highs in their inflation measures. Despite the largest global surge in prices since the 1970s. Despite all time extremes in policy measures across ZIRP, QQE, YCC, leading to the most accommodative negative real rate environment on record. Despite the JPY’s persistent weakening over the last year. Despite historically loose financial conditions. They are sticking with it and are certain that “IT WILL NOT WORK!”
We keep asking them the same question, the same question we’ve been posing to all central banks since the advent of QE and ZIRP, “What if it works?”. In the case of Japan, we posed that question to them in early 2022, namely what if your inflation measure goes from 0% to 1% and $/JPY from 105 to 115? Then to 2% and 125? Then to 3% and 135? Then to 4% and 145? Most recently we updated it to 5% and 155? Then 6% and 165? As readers have heard us say so many times before, they have consistently laid out their arguments, bolstered by strong beliefs for both overseas and at home of imminent reversals of inflationary trends in the face of still accommodative policy extremes, that IT WILL NOT WORK!
Figure 12: Japan CPI ex-Fresh Foods and Energy yoy% (white). $/JPY FX Rate (orange). JGB 2yr Yield (blue)

Source: Bloomberg
Other developed interest rate markets look noticeably different to Japan.
Figure 13: 2yr Swap Rates: JPY (white), USD (orange), EUR (purple), GBP (yellow)

Source: Bloomberg
Compare that to the respective Core CPI measures. Not so different.
Figure 14: Core CPI indices

Source: Bloomberg
We discussed it again last month. Central bankers should act like risk managers, not fortune tellers or puppeteers.
https://convex-strategies.com/2023/07/13/risk-update-june-2023-one-thing/
“We would, as ever, admonish central banks, just as we do with investment managers, to first and foremost act from a risk management perspective. It is not their job to manipulate expectation in a hope of guiding outcomes. Their “One Thing” should be resilient, robust, anti-fragile economies. Their policies should increase, not deteriorate, in efficacy as realizations deviate from mean expected outcomes.”
As tends to be the case, Nassim Taleb says if even more succinctly, clearly channelling Japan, in his epic book, “Antifragile”.
“Not seeing a tsunami or an economic event coming is excusable; building something fragile to them is not.” Nassim Taleb, “Antifragile”.
Will Japan, like all the other purveyors of ZIRP and QE, be fragile to rising interest rates at exactly the time they decide they want/need higher interest rates? Logically, it seems inevitable. Will Japan, the largest foreign bondholder in virtually every market on the globe, spread that fragility to already shaky duration holdings around the globe? It’s not hard to imagine.
When thinking about Japan, we can’t help but go back to the concept of Entropy. We found this great little clip from the folks at Veritasium (we absolutely love their videos). It is such a perfect analogy for Japan.
https://www.youtube.com/watch?v=DxL2HoqLbyA The Most Misunderstood Concept in Physics.

Like with all things that live in non-ergodic, path dependent space, time dependence matters. Something that may be a low probability in a limited specified time horizon, is a certainty over the course of unbounded time. The probability that Japan either allows or, as with the rest of the global central banking cabal, moves rates higher this month or next, might be quite low. The possibility that it happens in the reach of time, is a certainty.
As they say in the clip: “Life is spectacularly good at converting low entropy to high entropy.”
This goes back to the concept of Self-Organized Criticality, aka Sand Pile Theory. The low entropy accumulating pile of sand only appears stable. It wants to transition to its high entropy state, the post avalanche equilibrium of disorder as the sand chaotically spreads out across the table. To paraphrase the video, there is a clear difference between going to the past and the future and that difference is entropy. “An arrow of time.”
This is a fundamental flaw of Sharpe World methodology. It extrapolates the recent past (low entropy) and defines that as a state of the world. It misunderstands the arrow of time. Sharpe World tells us that Japan, its government at 260% of debt/GDP and its central bank who tells us that 3-4% CPI realizations does not exceed the 2% target, can carry on indefinitely down this path because it has done so thus far. In reality, however, they are merely fighting a losing battle against nature.
As prophetic crooner, Bad Blake, so eloquently put it, “Funny how fallin’ feels like flyin’, for a little while.”
Using past, stable appearing, occurrences of low entropy to extrapolate and forecast the future is a path to fragility. Being antifragile is to protect against and benefit from the complex dynamics in-between states of low and high entropy, ie. the critical state. Phase transitions, unforeseen, are where asymmetries exist.
This is precisely why we are so critical of Sharpe World investment practices that optimize to mean expected outcomes. Markets are non-deterministic. Past states of low entropy are not indicative of a continuation of that state. Just the opposite, in fact. The compounding path of investments are not ergodic, the arrow of time is all-important.
As we discussed last month, the Sharpe World investment mind-set is to maximize Expected Returns, forever selling the metaphorical straddle around the mean of their expectations. Always disregarding the destruction to the compounding path as, inevitably, actual realizations diverge from the mean expectation. They disregard the solution that long convexity brings because they dub it a “drag on the portfolio at the expected return” that is rarely, if ever, realised. They are happy to forego the long-term compounding benefit to avoid the single-period, inconsequential, “cost” in a single theoretical slice of time where their expectations come true.
It is easy enough to see comparing a hypothetical barbell splitting allocations 50/50 between participating assets, S&P Total Return (SPXT Index) and explicit protection, CBOE Eurekahedge Long Vol Index (EHFI451 Index) and comparing it to a 100% allocation to the behemoth of portfolio diversifiers, risk free (?) US Treasuries Total Return (LUATTRUU Index). It is pretty easy to make the case that, since the innovation of Quantitative Easing in March 2009, tying up large chunks of capital in sovereign duration bonds hasn’t done much for the end capital holder.
Figure 15: July2023 Barbell of 50% SPX Total Return and 50% Long Vol vs 100% US Treasury Total Return. March2009-July2023. Compounding View

Source: Bloomberg, Convex Strategies
Figure 16: July2023 Barbell of 50% SPX Total Return and 50% Long Vol vs 100% US Treasury Total Return. March2009-July2023. Ratio of NAVs

Source: Bloomberg, Convex Strategies
The Barbell has roughly half the Max Drawdown of the 100% allocation to bonds, over the period, -8.6% versus -17.8%, more asymmetric negative correlation to equities and, obviously, a lot more upside participation in the good times. The more that realisations diverge from the mean of expectations, the more the Barbell benefits.
As we quoted Mark Spitznagel back in our July 2021 Update:
“An overallocation to bonds and other risk mitigation strategies is the principal reason why public pensions remain underfunded today – an average funding ratio in the US of around 75 per cent – despite the greatest stock market bull run in history.”
https://convex-strategies.com/2021/08/20/risk-update-july-2021/
As ever, convexity is the solution. Solving the compounding problem does not require all that tricky of a solution, it just requires deciding that compounding is the objective you should be targeting.
Read our Disclaimer by clicking here