“Do you know the secret of life? One thing. Just one thing.” Curly Washburn. City Slickers, 1991.
We find this a very useful, and accepted, philosophy when it comes to risk management of any activity where there is “skin-in-the game”.
The real world of social domains is dominated by path dependent, non-ergodic processes. In a non-ergodic process, where time-averages diverge from ensemble-averages, the “one thing” to be avoided is that thing that we cannot recover from. In the endless array of path dependent activities that we humans undertake, there is almost always an obvious outcome that we know to avoid: death, insolvency, crashing.
Some examples.
What’s the secret of Formula One racing? One thing. Brakes.
The objective of a Formula 1 race is not who can go the fastest in one subset of a multi-circuit racetrack. It is not average lap-speed. It is standings at the end of the race. Without brakes, you aren’t finishing the race and you certainly aren’t driving aggressively with confidence.
Jeremy Clarkson explains it well at the 3:03 mark of this clip.
“I was once in a 24-hour race in Silverstone, driving a terrible old diesel BMW and yet I could keep up with a supercharged Jaguar XKR because I had better brakes.”
Mr Clarkson’s McLaren in the video has taken the concept of having better brakes to then go out and add the supercharged engine and a bunch of aerodynamic engineering to take advantage of said brakes. Superior braking ability allows greater acceleration and greater deceleration, the rate of change of speed, aka convexity.
What’s the secret of improved terminal capital outcomes in an investment process? One thing: effective risk mitigation. Again, convexity. Accelerating gains and decelerating losses, or the rate of change of returns is what truly matters.
The end capital owner isn’t concerned about annual arithmetic returns. It is geometric compounding, through time, that will achieve the desired terminal wealth. Without strongly convex risk protection, you aren’t cutting off the devastating negative compound events and will forever under-participate in the upside.
Ask just about any fiduciary wealth manager/advisor what they are doing about risk managing and they will tell you some sort of version of driving slowly to reduce risk, eg. 60/40. Foregoing upside to mitigate downside. They will probably throw in some sort of predictive ability about when and where difficult curves in the track will appear, and how some combination of timing and slow driving will probabilistically keep YOUR car from crashing.
They will also use every tool in the book to mask the deleterious impact on geometric compounding. They will show annual arithmetic returns. They will reference Sharpe Ratios, where foregoing upside is rewarded as a job well done. They will talk about expected returns, normal distribution probabilities, and stable correlations, as though it all accurately reflects the forward-looking layout of the yet unknown racing circuit. This is what we call Sharpe World.
We described Sharpe World this way back in our September 2022 Risk Update – “Is Sharpe World Closing?” https://convex-strategies.com/2022/10/18/risk-update-september-2022-is-sharpe-world-closing/
“We think of Sharpe World as a metaverse fantasy land where fiduciary wealth managers’ dreams all come true. Sharpe World is to the fiduciary what Big Rock Candy Mountain is to the roaming hobo here:
In Sharpe World, historical volatilities and correlations always remain constant. Geometric compounding paths are irrelevant. Tails are never fat. Leverage is not risk. Frequency matters more than magnitude. Ensemble averages dominate time averages. Hens lay soft-boiled eggs.”
The consensus practices of finance and economics today operate under a faux-scientific premise that markets and economies are deterministic, normally distributed, ergodic processes. They are not. Amazingly, nobody is really arguing otherwise. The justification for following the long-established Sharpe World methodologies is, basically, that it looks like it works pretty well most of the time. The failings, which are always there but just masked by scale, reveal themselves as actual outcomes diverge further and further from expected outcomes.
Our September 2021 Risk Update – “The Challenge of Measurement” went through much of the flawed process in some detail. https://convex-strategies.com/2021/10/19/risk-update-september-2021/
In that piece we led off with a quote from a Federal Reserve economist by the name of Jeremy Rudd.
“Mainstream economics is replete with ideas that ‘everyone knows’ to be true, but that are actually arrant nonsense.” https://www.federalreserve.gov/econres/feds/files/2021062pap.pdf
Sums it up well.
We have regularly shown the picture in figure 1 to visualize the importance of the infrequent but large tail occurrences of S&P 500 returns on its compounding path. The 2%tile (10 best and 10 worst months) of monthly returns dwarf the long-term compounding contribution of the other 460 months from July 1983 – June 2023. The further a realized return diverges from the mean, the more relevant its impact on geometric compounding. As we always say: “it’s just math”.
Of course, the other thing that stands out in the below picture is the unmatched potential contribution of superior brakes.
Figure 1: S&P 500 Returns 40yrs (grey) – Less 10 Best Months (red) and Less 10 Worst Months (blue)

Source: Bloomberg, Convex Strategies
Figure 2: Contribution to Long-Term CAGR. Worst 10 Months (orange). Best 10 Months (blue). Middle 460 Months (grey)

Source: Bloomberg, Convex Strategies
This all builds to our all-time favourite visual, the overlay onto the soccer pitch. As with traditional Sharpe World investment strategies, the Gaussian Normal distribution captures the frequency of outcomes. The frequency of monthly returns during an investing lifecycle or the frequency of where the ball spends time on the pitch during a match. The Entropy curve captures the magnitude or impact of those returns, the relevance to the outcome of the match of what happens inside the two penalty boxes. It is the 2%tile largest returns, negative and positive, that determine the path dependent outcomes.
We first discussed Shannon’s Entropy back in our April 2021 Risk Update “Shannon’s Entropy”. https://convex-strategies.com/2021/05/21/risk-update-april-2021/.
“Entropy aligns very logically to the concept of fat tails and to the value of tail risk hedging. Remember, fat tails are about the scale of their impact on the parameters of the distribution (mean and variance), not that they happen more often than Gaussian probability distributions would indicate. In fact, just the opposite.”
Figure 3: Frequency vs Magnitude. Normal Distribution vs Entropy Curve

Source: Bloomberg, Convex Strategies
Sharpe World investment/risk management strategies target the mean of expected outcomes. The Investopedia page on Modern Portfolio Theory literally describes it this way: “This mathematical framework is used to build a portfolio of investments that maximize the amount of expected return for the collective given level of risk.” We might argue, a better strategy could be one that is built to maximize actual returns.
Logically, a strategy based on estimated expected return, with risk and allocation determined by historical volatility and correlations, will have its best relative performance at the mean of the expectations. Deviations from mean, on either side, will immediately start to deteriorate the relative performance of the portfolio. The portfolio is inevitably exposed to changes in the presumed-steady volatilities and correlations. The further from the expected mean, the greater the divergence. This results in investment strategies that are ‘concave’ to their benchmark and exhibit negative return skew.
Many will have seen our hypothetical construction of the respective performance of a ‘Convex Portfolio’ and a ‘Concave Portfolio’ versus a 0.6x S&P Beta benchmark. The Convex Portfolio has good acceleration and deceleration away from the mean of the distribution, while the Concave Portfolio has the opposite.
Figure 4: Hypothetical Convex Portfolio (blue), Concave Portfolio (red) and 0.6x Beta Benchmark (grey) – Scattergram view 1972-2023

Source: Convex Strategies
Turning that into the compounding view results in something that looks, not surprisingly, precisely like our above S&P chart in figure 1.
Figure 5: Hypothetical Convex Portfolio (blue), Concave Portfolio (red) and 0.6x Beta Benchmark (grey) – Compounding view 1972-2023

Source: Convex Strategies
It is pretty simple, really. Deteriorating relative performance away from the mean expectation impedes compounding. Improving relative performance away from the mean expectation improves compounding. Convexity is the “One Thing”. It is the secret to turning negatively skewed returns into positive ones. Done correctly, it is the brakes that let you, confidently and safely, drive faster.
We can update our often-used hypothetical racing example of a simple Barbell Racer versus a supposedly sophisticated Balanced Racer. For the Barbell Racer we will use our favourite Always Good Weather (AGW) portfolio. This portfolio aligns well to our above contributions to long-term CAGR from the historical distribution of SPX monthly returns. It allocates 40% (20% 2x levered) to the CBOE Long Volatility Index (EHFI451 Index), targeting the 2%tile worst months, another 40% to the Nasdaq100 total return index (XNDX Index), targeting the 2%tile best months, and finally 40% to S&P500 total return index (SPXT Index), targeting the 96%tile middle months. The Balanced Racer will be represented by the pinnacle of Sharpe World investing strategies, Risk Parity, in this case the S&P Risk Parity Index – 10% Target Volatility (SPRP10T Index). AGW gets rebalanced annually.
We’ve highlighted in figure 6 the two months that have the biggest impact on the relative hypothetical compounding paths. Where the big impact to compounding appears to take place, the Barbell Racer shows superior deceleration and acceleration. In the months that have little impact to compounding, the two track along at a similar pace. All the while, though not measured ex post, one driver would be driving far safer than the other and can put on the gas whenever he sees daylight ahead.
Figure 6: Barbell Racer AGW 40/40/40 (blue) vs Balanced Racer Risk Parity (red). March’09 – June’23. Scattergram View and Return Distribution

Source: Bloomberg, Convex Strategies
Figure 7: Barbell Racer AGW 40/40/40 (blue) vs Balanced Racer Risk Parity (red). March’09 – June’23. Compounding View

Source: Bloomberg, Convex Strategies
Figure 8: Barbell Racer AGW 40/40/40 vs Balanced Racer Risk Parity. March’09 – June’23. Ratio of NAVs

Source: Bloomberg, Convex Strategies
Figure 9: Barbell Racer AGW 40/40/40 (blue) vs Balanced Racer Risk Parity (red). March’09 – June’23. Portfolio Statistics
| Portfolio A (Blue) | Portfolio B (Red) | |
| Max 6M Peak to Trough | -17.6% | -19.3% |
| Peak to Trough Max Drawdown | -17.6% | -19.3% |
| Biggest Monthly Drawdown | -6.0% | -10.7% |
| Sharpe Ratio | 1.4 | 1.0 |
| Sortino Ratio | 3.0 | 1.3 |
| Annualized Volatility | 11.4% | 10.0% |
| Downside Volatility | 5.2% | 7.7% |
| CAGR | 15.8% | 9.8% |
| Terminal Capital | 828.9% | 382.6% |
Source: Bloomberg, Convex Strategies
What are the basic differences in these two strategies? The Balanced Racer is betting on stable volatilities and correlations, then optimizing returns to realizations at the expected mean, where they have the least impact on compounding. The Barbell Racer is protecting against instability of volatilities and correlations, then optimizing returns to realizations that diverge from the expected mean, where they have the most impact on compounding. Put that way, it seems pretty obvious why the Barbell Racer generates significantly better compounded returns, on less Downside Vol and Drawdown Risk, than the Sharpe World alternative.
Drilling in even more practically, the Barbell Racer has benefitted by embedding negatively correlating protection, the CBOE Long Vol Index, creating the convexity that then allows more upside participation. “Participate and Protect” is one of our simplest catch phrases. Perfectly straightforward.
So where is the resistance? Well, it comes primarily from those wearing their Sharpe World goggles. The negatively correlating convexity, much like insurance, comes with a cost or, more accurately, negative carry. The Sharpe World practitioners look at negative carry as, probabilistically, negative expected return. Just like they look at positive carry as, probabilistically, positive expected return – no matter how many times it proves otherwise. If your super-advanced Sharpe World calculator is optimizing to expected annual arithmetic returns, based upon assumed constant correlations and volatilities, it sees paying for the convexity that provides resilience away from the expected mean as anathema.
Think about it from the Sharpe World perspective, where your whole premise is based upon expected outcomes, how would you even incorporate the concept of doing something with “absolutely no notion of the future”?
Worth watching the whole thing, but from the 24:50 mark Nassim Taleb drops some real pearls in this recent Bloomberg interview.
“We don’t care about outside events….. If you ever have a reason in mind to buy an option, don’t buy it. Because it will be priced in. We just buy options. We have absolutely no notion of the future.” Nassim Taleb, June 2023.
The good news, for those wishing to improve geometric compounding, is that Sharpe World participants will continue to provide all sorts of attractive, probability based, pricing to build the convexity that us Barbell Racer sorts will benefit from. Even when they see that the “One Thing”, in the path to Terminal Capital, is undertaking negative carry for the benefit of superior compounding and portfolio resilience, Sharpe World will continue to reject it.
Risk management is about resilience, robustness, anti-fragility. It is not about predictions and forecasts. If you want to get off the red lines and onto the blue lines, the simple answer is PAY for some efficient convexity and take more participating risk.
Regular readers will know, we talk about this a lot! The titles of past Risk Updates give it away.
Risk Update: July 2022 – The Pointlessness of Forecasting. https://convex-strategies.com/2022/08/16/risk-update-july-2022/
Risk Update: January 2023 – Understanding is a Poor Substitute for Convexity. (Another Nassim quote). https://convex-strategies.com/2023/02/16/risk-update-january-2023-understanding-is-a-poor-substitute-for-convexity/
Risk Update: March 2023 – Probability vs Possibility. https://convex-strategies.com/2023/04/14/risk-update-march-2023-probability-vs-possibility/
The same concept goes for economists and policy makers. Central Bankers tell us themselves what their, supposed, “One Thing” is. Generally speaking, it is ‘price stability’. We have lots of arguments with how this is implemented. For starters, it encapsulates Goodhart’s Law, where they have taken what should be a ‘measure’, some indicator of the well-being and stability of an economy (arguably a better “One Thing” for central bankers) and turned it into a ‘target’ in its own right. Thus, making it no longer useful as a ‘measure’. Further, they have redefined ‘price stability’ as at least 2% annual debasement of purchasing power against a wide variety of randomly chosen price indices and renamed it ‘inflation targeting’.
We argued, back in our April 2023 Update https://convex-strategies.com/2023/05/16/risk-update-april-2023-credibility/, for what we might consider central banker’s “One Thing” as being ‘credibility’. They need ‘credibility’ to maintain the confidence, granted them as unelected servants of the public, in the inherently fragile systems of fiat currencies and fractional reserve banking.
Central banker credibility, in particular around their shockingly poor track record of economic forecasting, has been a frequent topic of our ponderings. We’ve asked over and over again whether they are truly incompetent or if are they intentionally misleading us and then, which of these does more damage to their credibility. Our opinion is they are probably exhibiting some of both, but it is the latter, the intentional misrepresenting, that will do the greater damage to their credibility.
We got a bit of insight straight from the horse’s mouth courtesy of the recent ECB Conference in Sintra, Portugal. One of the panels, “Lessons from recent experiences in macroeconomic forecasting”, was anchored by such forecasting stalwarts, and frequent stars of these very pages, as Philip Lane and Huw Pill, respectively the Chief Economists of the ECB and the BOE. It was Mr. Pill who directly chimed in on the topic at the 1:25:00 mark of the below link.
“The role of CBs and CB forecasts is not necessarily to produce the best forecasts; the role is to support the best monetary policy decision which brings inflation back to target. I think that does lead you to a whole set of issues about how you organize your discussion internally and you allow that role for judgement, that role to have many different models, many different analytical frameworks, to help you have a robust and resilient view. Then ultimately how you convert that into a way of communicating with the public and financial markets. Monetary policy, and indeed economic policy making more generally, can have an effect on behaviour which supports what you are trying to achieve and internalizing that benefit is one that is pretty key to having a framework that just doesn’t put accurate forecasts, in some abstract sense, on a pinnacle above the thing that is the real importance of what the underlying process is.” Huw Pill, BOE Chief Economist. June 28, 2023.
Again, we are not clear if central banks, in this case the Bank of England, intentionally mislead or are incompetent.
An on-the-money quote from our February 2022 Update – “The Road to Serfdom & Pascal’s Wager.” https://convex-strategies.com/2022/03/18/risk-update-february-2022/
“It is only prudent never to place complete confidence in that by which we have even once been deceived.” Rene Descartes. (Risk Update February 2022 – “The Road to Serfdom & Pascal’s Wager.”
Mr. Pill, during his individual presentation portion of the panel, gave the following wonderful bit of explanation. He is telling the same story that we were addressing above when discussing Sharpe World investment strategies. He is noting that his Sharpe World forecasting methodology starts to breakdown as things move away from the mean expectation. Turns out, away from the mean, his “everything-else-equal assumptions” (ie. assuming constant correlation and volatility) and presumed linearity are nonsense. The fact that they are only just learning this, we suppose, falls into the better-late-than-never category.
“As inflation moves away from target, the everything-else-equal assumption that allows us to break down the contributions to the drivers of inflation in a linear way tends to become unworkable. The likelihood of second round effects is much stronger when there is a tight labour market. The impact of the shocks is not additive to one another but has an important multiplicative moment. Which means linear models are not very successful.” Hew Pill. ECB Sintra Conference, June 2023.
Again, apropos from our February 2022 Update.
“We do not describe the world we see, we see the world we can describe.” Rene Descartes.
We would, as ever, admonish central banks, just as we do with investment managers, to first and foremast act from a risk management perspective. It is not their job to manipulate expectations in a hope of guiding outcomes. Their “One Thing” should be resilient, robust, anti-fragile economies. Their policies should increase, not deteriorate, in efficacy as realizations deviate from mean expected outcomes. In our revered picture in figure 10, courtesy of the ECB’s Isabel Schnabel in November 2022, they should look at the future like the Consumer Survey (an Entropy view), not like the Professional Forecaster Survey (a Gaussian view).
Figure 10: Eurozone 3yr Ahead Inflation Expectations: Professionals vs Consumers
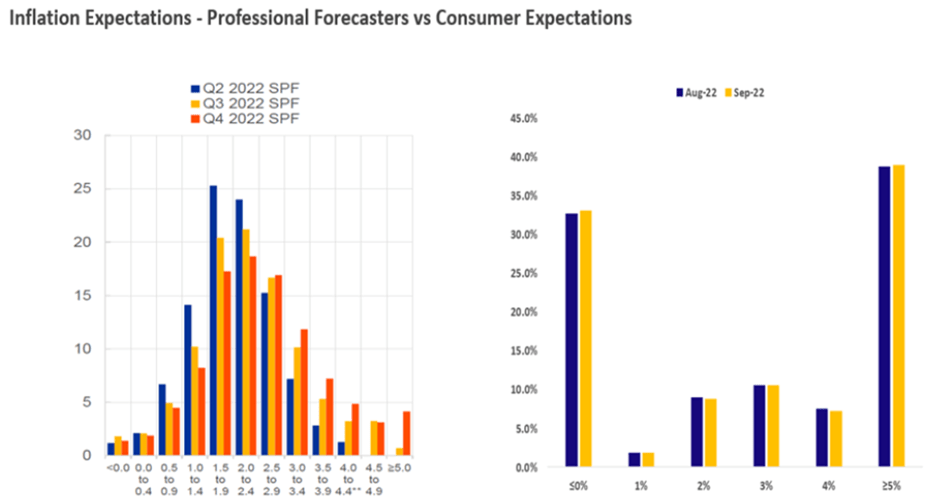
Source: ECB Speeches of the Board Members. Convex Strategies.
On a more positive note, in the main-event panel (at about the 5:50 mark in the link) with the heavyweight participants (Powell, Lagarde, Ueda, Bailey), Chair Powell threw out a rare pearl of honesty, echoing the comments of the BOE’s Catherine Mann that we noted in last month’s Update (https://convex-strategies.com/2023/06/15/risk-update-may-2023-phds-in-common-sense/) “Tightening and tight are not the same”. Chair Powell put it this way:
“Really, policy hasn’t been restrictive for very long. We started at negative real interest rates and have now moved up to where we actually are in restrictive territory, but we haven’t been there for very long.”
In our own jaded perceptions, we imagine this had the other distinguished discussants rather squirming in their seats, as they pondered the implications of their own policy settings from a real rates perspective.
Newly crowned BOJ Governor Ueda provided some comedic relief to the star-studded panel and, regrettably, not much else. Ueda-san (at the 8:33 mark in the above link) continues to echo the same mindset that his panel-mates all espoused as they were trying to resist moving away from their own all-time-accommodative policy settings.
“Although the headline rate of inflation is above 3%, which is well above the 2% inflation target, we think underlying inflation is still a bit lower than 2%. That’s why we are keeping policy unchanged at the moment.”
To her credit, the moderator of the panel pushed back a little and pointed out that Japan’s Core CPI measure is also above 2%, which Governor Ueda concedes is the case (also above 3% and, similar to headline, would be above 4% if not for the government fuel subsidy that kicked in as of February). Nobody mentioned that their Core-core, CPI ex-Fresh Food and Energy, is above 4%.
Figure 11: Japan CPI (blue), Core CPI (papaya) and Core-core CPI (white)

Source: Bloomberg
Another common descriptor of ‘underlying inflation’ (so much so that is how this chart is labelled) are trimmed mean measures. Here is one, again, from our clever friends at Wigram Capital Advisors.
Figure 12: Japan 10% Trimmed Mean CPI

Source: Wigram Capital Advisors and CEIC.
Also, above 4% and, according to our friends, “underlying inflation remains the problem”.
After the pushback, in a light effort to get Governor Ueda to maybe give away some details of this new, unspecified, defining benchmark of “underlying inflation”, Governor Ueda blamed the always popular scapegoat of wages.
“Let’s look at the rate of increase in wages, which is an important determinant of underlying inflation. It has risen but is now running at around 2%. If you want a 2% inflation rate, wage inflation that is consistent with that would be slightly or well above 2%, if you assume the productivity growth rate is positive. So, there is still some distance to go, we think.”
We shall see if Ueda-san learns some of the same hard lessons of his global peers. Is sticking to an increasingly stimulative policy setting, ever more negative real rates, looser financial conditions, weaker currency, in the face of the hottest economic circumstance in 40 years, good risk management? We find it difficult to imagine that his stated “One Thing” of precisely hitting a 2% target of his phantom measure of ‘underlying inflation’ will align to our preferred “One Thing” of a stable, resilient, economy when realizations deviate from expectations.
Read our Disclaimer by clicking here