What role do central banks play in such philosophical concepts as “the social contract/compact” and the “consent of the governed”?
That’s a pretty big rhetorical question, even for us.
Central banks are either part of or, at the very least, a creation of government. Broadly speaking, they operate on behalf of the “consent” granted government to manage the creation and control of money and credit (classically speaking, inflation). In today’s world that entails, most specifically, the oversight of fiat currency systems (ie. no longer any sort of hard currency backed by, say, gold) and fractional-reserve banking. Both of those, fiat currencies and fractional-reserve banking, necessarily require a significant element of trust and confidence, thus not insignificantly dependent on the credibility of those overseeing them.
Very simply put, central banks have defined their roles around maintaining trust and confidence in the fiat system by maintaining “price stability”, generally by explicitly targeting some minimal level of persistent but small debasement as defined by something like Consumer Price Index (CPI), eg. 2%. Further, in their role of maintaining trust and confidence in the fractional-reserve banking system, they pursue what they would call a “financial stability” mandate.
Readers can probably see where this is going. Credibility matters. With nothing backing the fiat currency, we need to trust that they won’t print away its value. With nothing backing deposits, we need to trust that our funds won’t be gambled recklessly.
Neither of these have been turning out particularly well as of late.
This latest ding to the financial stability credibility appeared on the FDIC’s website: “First Republic Bank, San Francisco, California, was closed today by the California Department of Financial Protection and Innovation, which appointed the Federal Deposit Insurance Corporation (FDIC) as receiver.”
https://www.fdic.gov/news/press-releases/2023/pr23034.html
We took a bit of time to discuss a couple of last month’s financial stability failures, if you haven’t seen it, we strongly recommend giving it a read. https://convex-strategies.com/2023/04/14/risk-update-march-2023-probability-vs-possibility/
We can quickly do a similar summary of First Republic Bank (FRB), again just by going to their own website and clicking into their recent Basel III Disclosures and 10-K filings.
https://ir.firstrepublic.com/static-files/89a1df66-7e28-4491-86aa-a331900db222
Figure 1: FRB’s Balance Sheet by Risk Weighted Assets. Dec 31, 2022

Source: First Republic Bank Basel III Regulatory Capital Disclosures
Figure 2: FRB’s Regulatory Capital. Dec 31, 2022

Source: First Republic Bank Basel III Regulatory Capital Disclosures
It is the same thing we saw with the Basel compliant disclosures of Silicon Valley Bank (SVB) and Credit Suisse (CB), various measures of capital divided by Risk Weighted Assets to determine compliance with regulatory capital standards.
Figure 3: FRB’s Regulatory Capital Ratios. Dec 31, 2022

Source: First Republic Bank Basel III Regulatory Capital Disclosures
As we are all very accustomed to hearing, First Republic Bank is/was “well capitalized”. Most importantly, from the perspective of FRB management (similar to the case with SVB), they reported more than sufficient Capital Conservation Buffers to pay themselves bonuses. “There were no limitations on the Bank’s distributions or discretionary bonus payments resulting from the capital conservation buffer framework.” Happy days.
Interestingly, in the FRB Basel III Disclosures there are no tables that represent Total Assets, Average Assets, or (as CS labelled it) Leverage Ratio Denominators. There is a mention of just the total number, no breakdown into categories, in the text – “As of December 31, 2022, we had total assets of $212.6 billion” – but that is it. Fortunately, those numbers can be found if you go to their 10-K filing and make your way to page 87.
Figure 4: FRB Average Assets 2022
Source: First Republic Bank Form 10-K 2022
A sharp eye will quickly note that the bulk of the circa $50bio excess of actual assets over risk weighted assets are residential mortgages. Without spending too much time, we can likely surmise that, unlike SVB and their exposure to US Treasury duration securities, the likely culprit for FRB will have something to do with flawed management, accounting and capitalization of residential mortgage lending. As we mentioned last month, these now failed banks are only different to other banks by levels of severity. They are all following the same Sharpe World based rules and regulations. Here is a nice little grid that we whipped up pulling info off the various respective Basel III Disclosures for a selection of banks.
Figure 5: Bank Regulatory Capital, RWAs, Total Assets (aka Leverage Denominator) and Ratios

Source: Respective Basel III Regulatory Disclosures. Convex Strategies
We can get a bit of a visual on that by plotting CET1 Capital Ratios (CET1 Capital divided by RWA) against the Asset/RWA (Leverage Denominator divided by RWA).
Figure 6: Global Bank CET1 Capital Ratios vs Assets/RWA. Dec 31, 2022

Source: Basel III Disclosures. Convex Strategies.
It is difficult to read too much into this. You might rationally surmise that banks with very high actual Assets relative to RWAs and/or lower CET1 Capital Ratios are indicative of high levels of risk. That may be true. But as CS showed, a bank with relatively low Asset/RWAs and a high CET1 Capital Ratio can still be in trouble. The problem with making any suppositions about these numbers is that they are all Sharpe World nonsense. It is dangerous to apply any real meaning to them because they mask, misrepresent, are inconsistent across entities, and so on. It is an exercise in obfuscation.
Even so, it is worth keeping in mind that all the big banks have significantly more actual assets, that they are not capitalizing, than they have risk weighted assets, that they are capitalizing.
We were moderately critical last month of then Financial Stability Board (FSB) Chair, Mark Carney, and his 2017 letter to the G-20 assuring the world that the banking system was well armed and trained to deal with whatever might come down the track once unlimited central bank support was withdrawn from markets. Conveniently, April saw a fresh letter to the G-20 from the current FSB Chair, Klaas Knot.
https://www.fsb.org/wp-content/uploads/P120423.pdf
“Recent events have put to the test the G20’s financial reforms that followed the 2008 Global Financial Crisis. The global financial system is much better placed to absorb adverse shocks as a result of these reforms, which included considerable increases in the levels of bank capital and liquidity, an international framework for effectively resolving failing institutions, and strengthened cross-border regulatory and supervisory cooperation.”
It is unlikely that Mr. Knot will be held any more accountable for those words than Mr. Carney was for his. It is a confidence game.
Of course, again, the FSB stresses the importance of harmonization. If only we could get more banks doing more of the exact same things and adhering to the same financial standards that CS, SVB and FRB were adhering to.
“The full, timely and consistent implementation of international financial standards remains key to bolstering global financial stability.”, Mr Knot continued.
Credibility? The fractional-reserve banking scheme needs it. If banks around the globe are going to nuke their own liquidity by not paying market interest rates for their liabilities, to then expose their own insolvency as deposits flee, you inevitably create a very negative feedback loop. It all strikes us as a clear example of people trying to get their capital out of Sharpe World. As we keep asking, will they close the gates?
Well, for now anyway, they seem committed to just trying to maintain confidence, through both liquidity provision (eg. BTFP) and promises (eg. one-off guarantees of uninsured deposits).
Not surprisingly, this issue is of concern around the globe. The European Commission recently released a “Communication on the review of the crisis management and deposit insurance (CMDI) framework contributing to completing the Banking Union.”
The actual linked communication is only 5 pages. It is worth a read just to confirm for yourself that it actually says, give or take, nothing about what they are actually doing or, rather to be fair, proposing.
It tells us that everything is fine: “The SSM (Single Supervisory Mechanism) and the SRM (Single Resolution Mechanism), together with the reinforced rules on banking supervision and resolution, have ensured that the EU banking sector has greatly increased its resilience to shocks and overall, is in good shape.”
Yet, there is more that needs to be done and it has yet to be agreed: “The third pillar – a common deposit protection scheme – is also key in reinforcing the resilience of the banking sector, but political agreement among the EU co-legislators has not yet been achieved.”
At the risk of being cynical, they seem to be saying that the system is just fine, given the measures that they have put in place post the last crisis, but they need to do more, nevertheless, to provide yet greater backing. Inconveniently, that which they need to do does not come with the political agreement to enact it.
Throughout the communique, as well as the 16 page FAQ (https://ec.europa.eu/commission/presscorner/detail/en/qanda_23_2251), they never really tell us what it is that they are going to do, assuming they somehow get their hands on the political agreement that has, thus far, eluded them. The whole thing reads like something out of a consultant’s workshop on positive perception writing skills. They talk about the objectives. They talk about the importance. They talk about the positive assessment of what it will achieve.
“The impact assessment, which accompanies the legislative package adopted today, shows that the proposed reform of the CMDI framework would be even more effective if combined with a common deposit insurance scheme.”
They get in all manner of catchy phrases, as if from the Positivity Thesaurus itself: “ensure a level playing field” “avoid market fragmentation” “create efficiency gains” “enhance consistency” “strengthen central governance”.
Sounds great!
There is even a catchy pdf with nice visual representations.
https://finance.ec.europa.eu/system/files/2023-04/230418-banking-union-factsheet_en.pdf
EU Commission CMDI Communication.

We would be suspicious that this was all somehow in response to the events surrounding SVB and CS, in particular the explicit covering of uninsured depositors in the US, but they assure us otherwise. “While the reform of the CMDI framework has been under discussion for several years and pre-dates the very recent U.S. and Swiss banking crises, these crises underline the importance of ensuring that EU arrangements for managing bank failures are as robust and effective as possible.” Right.
Imploring depositors not to flee European based Sharpe World banking institutions.
ECB President Lagarde is clearly aware of the pending challenge that we generally frame as “who is going to own the 40?” That is, who is going to own the bonds when their misrepresented role as riskless, or even risk mitigating, is laid bare. How will excess of 100% debt/GDP governments fund themselves if, as we are seeing, capital owners pull their money out of Sharpe World financial fiduciaries? Ms. Lagarde danced around this issue in an April speech in New York titled “Central banks in a fragmenting world.”
https://www.ecb.europa.eu/press/key/date/2023/html/ecb.sp230417~9f8d34fbd6.en.html
“(A)chieving the right policy framework will not only determine how our economies fare at home, but also how they are viewed globally in a context of greater ‘system competition’….For a start, an economic policy mix that produces less volatile growth and inflation will be key in continuing to attract international investment.”
While central banks were pinning down interest rates through ZIRP/NIRP monetary policy settings and undertaking extraordinary balance sheet expansion through unbounded QE, there was little concern about competition for funds to hold onto ever-escalating sovereign bond issuance. Deposits poured into banks that were allowed to run 20-30x levered balance sheets of government bonds. Pension fund accounting methodologies were aligned to define levered sovereign bond holdings as “hedges”. Solvency II pushed insurance companies to capital necessities of holding long duration government debt. All while many of the central banks themselves were buying up more than total net issuance by profligate governments.
This is an interesting speech, even a bit out of character, we would argue, for Ms. Lagarde. She starts with the obligatory assignation of blame for current circumstances on the usual list of unforeseeable exogenous events – “the pandemic, Russia’s unjustified war against Ukraine, the weaponization of energy, the sudden acceleration of inflation, as well as the growing rivalry between the United States and China.” Normally they blame the other exogenous items for causing the inflation, as they call it, as opposed to including it as an exogenous shock in its own right but, as ever, it is clear that their all-time most aggressive policies to try to stimulate greater inflation had nothing to do with said acceleration. Ms. Lagarde, in no uncertain terms, assures us that, despite their past extreme reflationary policies having nothing to do with the recent acceleration of inflation, “independent central banks will go ahead with ensuring price stability.”
What we find a bit out of the ordinary are Ms. Lagarde’s stabs at a) fiscal policies and b) political issues. Per point a) she proffers “if fiscal policy instead focuses mainly on supporting incomes to offset cost pressures (in excess of temporary and targeted responses to sudden large shocks), that will tend to raise inflation, increase borrowing costs and lower investment in new supply.” On point b) “for Europe, long-delayed projects such as deepening and integrating our capital markets can no longer be viewed solely through the lens of domestic financial policy. To put it bluntly, we need to complete the European capital markets union.” This links right into our above discussion about the CMDI framework, ie more Europe.
The gist of her speech is that “fragmentation” is dangerous. We would translate that as “who is going to own the 40?”
Who is going to own Italian bonds at something like 145% of debt/GDP?
Figure 7: Italy Debt/GDP through Dec 2022

Source: Bloomberg, Convex Strategies
Who is going to own French 10yr bonds at nearly 4% below French HICP yoy%.
Figure 8: France HICP yoy% (white) vs 10yr Bond Yield (papaya)

Source: Bloomberg, Convex Strategies
Fragmentation is what happens if capital flees Sharpe World and the financial institutions, that need to step in to replace the incessant central bank buying of these bonds, are unable to do so. Thus, things like blanket deposit guarantees. Fragmentation is a polite way of framing a solvency issue.
This brings us to the proverbial comment that ‘central banks will hike until they break something’. We would argue that they are well into “breaking” any credibility left in their financial stability bona fides. This has led to a fairly loud chorus, even amongst the central banks themselves, that it is time to cease the tightening efforts, done over the last year give or take, and to prepare for the soon-to-come rate cuts as we enter the long anticipated, inevitable, recession. As we have heard for so long, they can’t let rates go higher!
But hold on for a second. After embarrassing themselves through their “transitory” phase, have CBs done enough to restore their credibility as the keepers of the global fiat system? Has confidence in price stability been re-established?
With little commentary, we lay out below some simple visualizations on the current standing in the various CB’s fights to restore price stability.
The Fed has clearly been the most aggressive in adjusting their policy rate, the Fed Funds rate, and have seen a sharp reversal in the yoy% change of their Headline CPI rate as, in particular, goods prices have reversed course. Core CPI, however, has not seen the same pace of slowing, as services and wages continue to be sticky. The Core inflation issue is a common theme across all our examples.
Figure 9: US CPI yoy% (blue). US Core CPI yoy% (white). Fed Funds Rate (papaya)

Source: Bloomberg, Convex Strategies
Using the Core CPI and simply deducting it from the policy rate, we get a proxy for the real policy rate. In the US case, that has come from an absolute historical negative extreme to now getting ever so close to a 0% real rate. Not exactly “tight” but a long way towards removing the extraordinary accommodation that was in place a year ago.
Figure 10: US Real Policy Rate: Fed Funds – Core CPI yoy%

Source: Bloomberg, Convex Strategies
Using a standardized measure, in this case a Taylor Rule Estimate, we can get some sense of the relative tightness/looseness of policy rate on an historical perspective factoring in both price stability measures as well as employment indicators. Again, the Fed has come some way to pulling back from what was an historical extreme in ‘looseness’ but is still some distance away from what would have been deemed ‘tight’. Over the period represented below, Bloomberg calculates the Fed to be in the 4.6%tile on a looseness vs tightness distribution.
Figure 11: US Fed Funds (white) vs US Taylor Rule Estimate (papaya). Spread (yellow)

Source: Bloomberg, Convex Strategies
In the case of the ECB, we see below that the issue with their Core HICP measure stands out even more so as it continues to grind higher, even as the Headline HICP has reversed sharply from its Q4 2022 peak.
Figure 12: Eurozone HICP yoy% (blue) and Core yoy% (white). ECB Deposit Rate (papaya)

Source: Bloomberg, Convex Strategies
Again, we can see that their unprecedentedly aggressive hiking cycle has pulled our real policy rate proxy away from the absolute negative extremes, yet they are still deep in negative real rate territory. Despite the fastest hiking cycle in ECB history, by this simple measure, they are still not what would, in a traditional sense, be deemed ‘tight’.
Figure 13: Eurozone Real Policy Rate: ECB Deposit Rate – Eurozone HICP Core yoy%

Source: Bloomberg, Convex Strategies
Likewise, using the Taylor Rule Estimate as a standardized heuristic for broader overall economic circumstances, the ECB has barely moved away from all-time extreme ‘looseness’. Per the below, the ECB has but climbed to the 3.6%tile in their historical distribution.
Figure 14: ECB Deposit Rate (white) vs Eurozone Taylor Rule Estimate (papaya). Spread (yellow)

Source: Bloomberg, Convex Strategies
For our Australia example we have used their CPI Trimmed Mean as the proxy for a Core measure of inflation. This measure is, again, proving quite sticky, most recently being reported for Q1 2023 at a yoy% of 6.6%.
Figure 15: Australia CPI yoy% (blue) and Trimmed Mean yoy% (white). RBA Policy Rate (papaya)

Source: Bloomberg, Convex Strategies
Similar story here. Despite the rapidity of the rate hike cycle, which was far more aggressive than signalled a year ago by the RBA, they have barely managed to keep up with the continued rise in their Trimmed Mean measure. This leaves them, by this simple measure, still in the vicinity of extreme ‘loose’.
Figure 16: Australia Real Policy Rate: RBA Policy Rate – Australia CPI Trimmed Mean

Source: Bloomberg, Convex Strategies
Given the accompanying tightness in labour markets (common across all our examples) we get the obvious result in our comparison to a Taylor Rule Estimate. RBA is still extremely ‘loose’. By this measure, they are in the 3%tile on the ‘looseness’ to ‘tightness’ spectrum.
Figure 17: RBA Policy Rate (white) vs Australia Taylor Rule Estimate (papaya). Spread (yellow)

Source: Bloomberg, Convex Strategies
The RBA, having paused in their April policy meeting, did get back in the game with a 25bp hike at their May 2nd meeting. Governor Lowe gave a follow up speech later that evening in Perth where he continued with his efforts to “communicate”. Despite past lessons hard-learned, he threw in this definitive statement – “We also received confirmation that the peak in inflation in Australia is now behind us…” Without accountability, there can be no learning. https://www.bis.org/review/r230503e.htm
We highlighted last month a speech from Bank of England (BOE)Governor, Andrew Bailey, as a prime example of the current popular form of misrepresentative communication from modern-day central bankers. It would appear that a consensus has been formed inside the BOE as to this line of communication as Huw Pill, the Chief Economist, took to the podcast circuit for a hold-my-beer moment to reiterate the seemingly agreed spin-campaign. You can listen via the link below, or just read the quick summary from the Guardian.
The money quote, one that got a fair amount of derogatory subsequent press, was this one.
“Somehow in the UK, someone needs to accept that they’re worse off and stop trying to maintain their real spending power by bidding up prices, whether higher wages or passing the energy costs through onto costumers……We’ve had a series of inflation shocks that come one after the other. Each of those shocks was transitory, but they were timed in a way that inflation never dissipated.”
https://www.mirror.co.uk/news/uk-news/bank-england-boss-centre-row-29848250
The Mirror article describes Mr Pill thusly, “an Oxford educated ex-Goldman Sachs economist, is the Bank of England’s chief economist, responsible for analysis used for policy decision.” Ouch. Like Governor Bailey before him, Mr. Pill reiterates that despite their explicit price stability mandate and following on from an unprecedented period of never before tried monetary stimulus, it is not the BOE’s fault that the inflation has spiralled to multi-decade highs. It is your fault! BOE, as with the others, continues to look at sticky Core measures of inflation. Somewhat unusually, however, their headline numbers have also stayed relatively elevated.
Figure 18: UK CPI yoy% (blue) and Core yoy% (white). BOE Bank Rate (papaya)

Source: Bloomberg, Convex Strategies
They have, however, after multiple hikes, eaten into the extent of their negative real policy rate. Hard to say they are ‘tight’, just yet.
Figure 19: UK Real Policy Rate: BOE Bank Rate – UK Core CPI yoy%

Source: Bloomberg, Convex Strategies
Similarly, comparing to history with the Taylor Rule Estimate as a proxy for overall economic circumstances, you would be inclined to class them as still pretty much on the ‘loose’ end of the spectrum.
Figure 20: BOE Bank Rate vs UK Taylor Rule Estimate

Source: Bloomberg, Convex Strategies
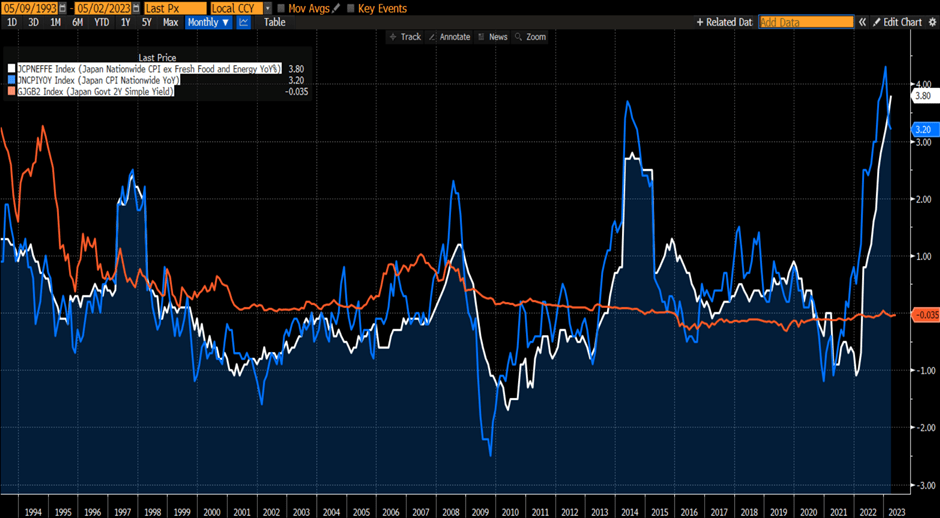
That leaves us with the CB that hasn’t even started to reduce their accommodation. The BOJ still has the monetary stimulus turned up to an 11. NIRP, QQE, YCC on full throttle. Meanwhile, their CPI ex-Fresh Food and Energy measure is at a 40yr high and continues to be on a straight-line-up trajectory. It is necessary, always, to point out that the reversal in their Headline CPI number is virtually entirely down to a fuel and energy subsidy that kicked in mid-Q1 this year.
Figure 21: Japan CPI yoy% (blue) and ex Fresh Food and Energy yoy% (white). JGB 2yr Yield (papaya)
Source: Bloomberg, Convex Strategies
Obviously, with policy setting and price measures at opposite extremes, that leaves BOJ out in Never Never Land on the negative real rate metric.
Figure 22: Japan Real Policy Proxy: JGB 2yr Yield – Japan CPI ex-Fresh Food and Energy

Source: Bloomberg, Convex Strategies
The same goes for the broader measure of economic circumstance. Can’t get much further in the wings than the 0%tile.
Figure 23: JGB 2yr Yield (policy proxy) vs Japan Taylor Rule Estimate

Source: Bloomberg, Convex Strategies
Despite the unprecedented scale of their monetary accommodation, aligned with multi-decade increases in their chosen price stability measure, the BOJ continues to communicate their firm belief that their inflation targeting policies WILL NOT WORK! https://www.boj.or.jp/en/mopo/outlook/gor2304a.pdf
In their April quarterly update on “Outlook for Economic Activity and Prices”, despite the yoy% running at 3.8% through March, they continue to forecast it falling back down below 2% by fiscal year 2024.
Figure 24: BOJ Forecasts as of April 2023

Source: https://www.boj.or.jp/en/mopo/outlook/gor2304a.pdf
Figure 25: BOJ CPI ex-Fresh Food and Energy Quarterly Forecasts April 2021-April 2023

Source: BOJ.or.jp, Convex Strategies
No matter the circumstance, it always comes back below 2%. No matter how extreme their policy setting, they are confident it will not work and, yet, committed to stick with it.
Overall, the Fed would seem to have done the most to normalize policy back to something approaching neutral. The ECB, RBA and BOE, at least if you think real rates matter, would appear to have not done enough. The BOJ just keeps getting looser. We have to assume that their price stability credibility took a pretty good knock during their “transitory” phase. Yet to be determined how they will fare in the current “we’ve done enough” phase.
This is where some folks jump in and argue that the mythical “neutral rate”, aka “r*”, is now so low that maybe some level of negative real rates is indeed the “neutral rate”. The whole “neutral rate” argument, in our opinion, is pretty much just Sharpe World hogwash. Anyone interested in confirmation on that point should feel free to click into the below link to a recent IMF paper on the subject; “Low for (Very) Long? A Long-Run Perspective on r* across Advanced Economies.”
The authors note that they rely on a methodology to “estimate r* because, by imposing some economic structure, it returns estimates which are closer to theoretical predictions than simple empirical proxies like observed long-term real rates.” They further note that “another important finding is that our estimate of r* shows a surprisingly weak correlation with real interest rates.”
Don’t let the lack of empirical support dissuade you from an intriguing model. As Hayek put it “On this standard there may thus well exist better “scientific” evidence for a false theory, which will be accepted because it is more “scientific”, than for a valid explanation, which is rejected because there is no sufficient quantitative evidence for it.”
https://www.nobelprize.org/prizes/economic-sciences/1974/hayek/lecture/
For a rational discussion, we would refer interested parties to a January 2018 speech from Claudio Borio.
https://www.bis.org/speeches/sp180110.pdf
Mr. Borio turns the accepted premise of the “lower for longer” neutral rate on its head by suggesting that we should reverse the linkage with “causality running from interest rates to productivity”. This lines up precisely with our own often used Snickers bar analogy. Low rates beget low rates. https://convex-strategies.com/2022/04/26/risk-update-march-2022/
The CBs are, to our impressions, still trying to be seen to be battling price instability through nominal yield adjustments, while fuelling sustained growth and asset bubbles with negative real rates. All the while trying to manage our perceptions through their skills in guidance and communication, with the omnipresent issue of financial system fragility lurking just under the surface. As we say, it is quite the tightrope.
A big part of that fragility revolves around the unrecognized losses sitting across the balance sheets of Sharpe World institutions. The uncapitalized “40” of the magical “60/40” that exists in Sharpe World on a spectrum from riskless to risk reducing.
How have those bond holdings fared from an investment perspective over the last 10 years? Not particularly well, particularly when looked at on a real return basis. The following charts are just respective Total Return Bond indices that we have deflated with the relevant CPI indices.
Figure 26: US Treasury Total Return Index Nominal (black) and Real (red). Apr2013-Mar2023

Source: Bloomberg, Convex Strategies
Figure 27: EUR Agg Total Return Index Nominal (black) and Real (red). April 2013-Mar2023

Source: Bloomberg, Convex Strategies
Figure 28: GBP Gilt Total Return Index Nominal (black) and Real (red). Apr2013-Mar2023

Source: Bloomberg, Convex Strategies
Figure 29: 10yr Tale-of-the-Tape USD, EUR, GBP

Source: Bloomberg, Convex Strategies
Ten years of negative real returns. A problem that, contrary to popular Sharpe World orthodoxy, adding leverage to isn’t going to make any better. Ten years of tied up capital for virtually zero annualized nominal return and significantly negative real returns. At the initiation point, back in 2013, the then real 10yr yield was plus or minus around 0% (highlighted in yellow). The current 10yr real yields (circled in red) are all significantly negative. Do 10yr nominal bond yields from 2.3% to 3.5% compensate long term investors for the risks? In an environment of higher volatility of inflation measures, can bonds be relied upon as a low volatility, negatively correlating, portfolio complement?
What could investment managers have done to avoid tying up massive chunks of capital in these sans-compounding bonds over the above 10yr period? If we assume investors were happy with the sort of risks, defined as Downside Volatility or Max Drawdown, involved with holding the traditional 60/40 balanced portfolio, we can play our usual game and construct theoretical risk-equilibrated convex-barbell type portfolios. As usual, we suggest a convex-barbell approach with allocations that either participate or protect. Using the CBOE Eurekahedge Long Volatility Index (an index of active Long Volatility managers) as our protection leg and simply adding more SPX Total Return (SPXT Index) for greater participation, we can construct far more efficient hypothetical portfolio complements than were delivered by holding US Treasury bonds over the chosen period.
For this hypothetical worked-example, we take the bond allocation and split it 62.5% into equities and 37.5% 2x levered, so 75% exposure, into the LongVol proxy. Comparing that to a 100% US Treasury (we use the Bloomberg US Treasury Total Return Index) allocation looks like the below. We will come back to why we have chosen these weights.
Figure 30: Barbell SPXT 62.5%/LongVol 75% (blue) vs US Treasury 100% (red)
Scattergram and Return Distribution

Compounding View

Ratio of NAVs

Source: Bloomberg, Convex Strategies
Just visually, you can see that the convex alternative tracks along with the bond allocation in normal times, then separates when market returns realize in the wings. Also, when paired with participating risk, the notorious optics of “bleed” regarding an allocation to long volatility are solved (assuming one can add two numbers together). So overall, seemingly an approach that could deliver less risk, more return and superior diversification.
We can extend the hypothetical example and substitute it for bonds in the traditional balanced 60/40 portfolio, adding the 62.5% of the 40%, so 25%, to the equity allocation, and 75% of the 40%, so 30%, to the LongVol allocation. That leaves us with a revised Barbell of 85% SPX Total Return and 30% Long Vol.
Figure 31: Barbell SPXT 85%/LongVol 30% (blue) vs Balanced SPXT 60%/US TSY 40% (red)
Scattergram and Return Distribution

Compounding View

Ratio of NAVs

Portfolio Statistics

Source: Bloomberg, Convex Strategies
In this hypothetical worked example, the Barbell has less risk (DownVol of 5.3% and MaxDD of 16.6% vs 6.3% and 19.6%), higher returns (CAGR of 10.5% vs 7.8%), thus improved Sortino (2.0 vs 1.2) and, necessarily, better terminal capital (273 vs 213).
We chose these weightings to try to equalize the DownVol and MaxDD risks, but that is just a game we can play on and on. There is no one right answer, and merely looking backwards does not tell much, if anything, about the path forward. What we are convinced of is that compounded returns will be driven by performance in the wings. We know that what gets shirked as “bleed” is, in reality, the solution to the compounding problem. That solution being positive convexity and a cleansing of capital tied up in strategies that neither participate nor protect. Sharpe World strategies, those that are optimized to the probabilistic expected outcomes, are anathema to compounding. Compounding is driven in the realm of possibilities, where the unexpected opportunities and unforeseen dangers reside.
Read our Disclaimer by clicking here