In last month’s Update, we pondered the question “what about the 40?”. This has long been a topic of our own discussions and clearly an issue that rose to the front of many people’s minds in the month of September. In the gigantic world of wealth management, we simplify down to the core premise of 60/40 as a market standard of what we commonly refer to as a “balanced portfolio”, a portfolio of 60% Equity “balanced” with 40% Fixed Income. Of course, it is just a core proxy, a skeleton framework, representing an enormous array of investment strategies that all culminate from the financial and economic mathematics that create what we like to call “Sharpe World”.
Figure 1: The Building Blocks of Sharpe World

Source: Convex Strategies
We discussed in some detail the failings of, and some straightforward fixes to, Sharpe World methodologies in our September 2021 Update, “The Challenge of Measurement” https://convex-strategies.com/2021/10/19/risk-update-september-2021/.
We think of Sharpe World as a metaverse fantasy land where fiduciary wealth managers’ dreams all come true. Sharpe World is to the fiduciary what Big Rock Candy Mountain is to the roaming hobo here: https://www.youtube.com/watch?v=JqowmHgxVJQ
In Sharpe World, historical volatilities and correlations always remain constant. Geometric compounding paths are irrelevant. Tails are never fat. Leverage is not risk. Frequency matters more than magnitude. Ensemble averages dominate time averages. Hens lay soft-boiled eggs.
Readers should be familiar with our concept of “uncapitalized tails”, risks that through negligence and poor risk/accounting practices end up not being supported with appropriate loss absorbing capital. Likely the most well known uncapitalized tails of modern times were the holdings of tranched mortgage securities on bank balance sheets. They were a key factor in the unravelling known as the Great Financial Crisis (GFC) and led to the government bailouts of pretty much the entire global banking system. The Sharpe World maths and accompanying regulation, paired with undeniably flawed fiduciary incentive structures, allowed for a total mis-accounting of the risk of these instruments, the application of nearly unlimited leverage, and a total dearth of capital to absorb the inevitable losses when they arrived.
It doesn’t take a great mental leap to determine that a major (perhaps the major) uncapitalized tail that has built up over the last 35 years, call it the era of the “Greenspan Put”, is the Sharpe World driven universal belief and application that the Fixed Income component of the 60/40 portfolio, and all of its many variations, is RISK REDUCING! In Sharpe World, the Fixed Income characteristics of low volatility, bounded upside, low to negative correlation is deemed to have a portfolio benefit and reduces, in effect, the amount of capital you would otherwise deem necessary to hold against potential losses on the portfolio.
That, of course, only holds as long as the Sharpe World assumptions of low volatility and low/negative correlation to the other portfolio components persists. Those beneficial components have persisted for a reasonably significant number of years, but notably aided and accentuated through active manipulation by central bank policy makers through ever greater interventions to drive yields lower and to suppress/curtail volatility, particularly around events that necessitated the negatively correlating response. That is not currently the case.
Figure 2: US Treasury Total Return Index – 17.3% current drawdown

Source: Bloomberg
Figure 3: SPX Total Return Index -24.3% current drawdown simultaneously

Source: Bloomberg
Figure 4: MOVE Index of US Interest Rate Volatility

Source: Bloomberg
Figure 5: US 10yr Treasury Bond Price vs SPX Index 60d Rolling Correlation

Source: Convex Strategies, Bloomberg
When the assumptions of low volatility and negative correlation fail, the magical 60/40 loses its lustre.
Figure 6: Bloomberg 60/40 Index

Source: Bloomberg
A broad generalization of the industry standard for wealth management, the balanced portfolio aka 60/40, is that the Fixed Income component is risk reducing, not risk additive. Not only does it not attract a capital allocation on its own (even if it did, in Sharpe World with its low volatility and bounded upside, it would be a very low capital allocation) but it is deemed to reduce portfolio risk, thus reducing overall capital requirements at a portfolio level.
Take that to the next step, as is ever the case in Sharpe World, and you get to the logic that levering the Fixed Income component is even more risk reducing. This is the inevitable evolution to ever more thrilling Sharpe World rides along the lines of Risk Parity and Liability Driven Investment strategies (LDI), not to mention the whole slate of LTCM-like levered carry cum risk premia strategies.
Figure 7: S&P Risk Parity Index (10% Vol) – Sharpe World Poster Child

Source: Bloomberg
We discussed it, yet again, back in our December 2021 Update https://convex-strategies.com/2022/01/17/risk-update-december-2021/. In that note we linked and quoted this wonderfully straightforward note from Nassim Taleb:
https://www.academia.edu/50833426/Pension_Funds_Should_Never_Rely_on_Correlation
“The so-called ‘optimal’ portfolio is in effect the worst of all worlds. It offers scant protection against tail risk and, at the same time, achieves an under-allocation to the riskier assets with higher returns in the long periods of economic expansion such as the past decade.”
Imagine the scenario where the balanced portfolio methodology turns out to not just offer “scant protection” against tail risk but, courtesy of the crowding of positioning across the entirety of the savings management world plus the addition of leverage, to be the source of the tail risk. The complacency and leverage of the Fixed Income component, in reliance on the historical frequency of low volatility and negative correlation, is the uncapitalized tail. If you ever doubted that assertion, you likely got a good introduction to the problem when you heard, possibly for the first time, about the UK’s LDI pension fund investment scheme in September.
It is easy enough to jump online and search for information on LDIs. It is hardly a secret. Here is just one of multitudes of examples that lay it all out.
This one simple image tells you pretty much all you need to know.
Figure 8: Liability Driven Investment (LDI). Leverage and Rising Interest Rates.

Source: BMO Global Asset Management.
In Sharpe World, this use of leverage is considered “hedging”, it is allegedly risk reducing. In Sharpe World, the value of the “Collateral Pool” and the “Other Assets” are not correlated. In Sharpe World, historical volatilities are considered a proper measure of future risk, regardless of how much past manipulation and vol suppression has been applied by your friendly central bank. In Sharpe World, future distributions of returns are assumed to be normally distributed, not fat tailed and certainly not reflexive.
The simple takeaway from the above visual representation is – what happens if rate rises cause the liabilities to fall by 33%, as opposed to the 16.7% in the above example? Well, that would wipe out 100% of the collateral pool (the blue box), increase “LDI Leverage” to infinite, and necessitate liquidating 33% (£67mio) of the “Other Assets” to restore leverage to 3x. It that were to happen nearly instantaneously, and if it turned out your other assets were unexpectedly correlated, both in price terms and in liquidity terms, to your collateral pool, despite all that was promised in Sharpe World, you would be in one heck of a pickle.
Figure 9: Bloomberg UK Gilt 15+ Total Return Index. “The Pickle”

Source: Bloomberg
In this particular jar, it is reputed that much of the leverage is in the form of interest rate swaps, which may have something to do with the widening of swap yields relative to bond yields in the recent episode.
Figure 10: UK 10yr Swap Rate vs 10yr Gilt Yield

Source: Bloomberg
We might venture that, should markets lose confidence in the inflation fighting credibility of respective central banks, one might expect growing risks for such sort of explosive action in the highly levered/undercapitalized back-end portions of government bond markets. The below picture gives a pretty rational indication of why sparks might find their way to these piles of dry brush.
Figure 11: UK Gilt 10yr Yield (white), CPI yoy% (blue) and BOE Bank Rate (orange)

Source: Bloomberg
Fortunately, the powers-that-be in the UK are all on top of the issue. Allegedly.
From the November 2018 Financial Stability Report, in the section titled “The FPC’s assessment of the risk from leverage in the non-bank financial system”, we get this:
“This analysis suggests that a small minority of non-banks would face margin calls in excess of their available liquid asset buffers. The shortfall increases non-linearly with the size of the shock, since more non-banks experience margin calls in excess of their available liquid assets (Chart H.2). However, the liquidity shortfall, and corresponding potential amount of forced asset sales, remains small as a proportion of the total demand on liquidity (9% of total estimated margin calls under a 100 basis point interest rate shock). Even if all non-banks were to sell only sterling corporate bonds to obtain the liquidity to meet this shortfall, this is still equivalent to just 7% of monthly trading volume in the sterling corporate bond market.
This analysis also assumes that non-banks do not take any mitigating actions, such as closing out derivatives positions. This assumption is very conservative, particularly when assuming larger interest rate shocks that do not tend to occur on a single day. For example, a 100 basis point increase over a single day or a single week has never been experienced in 10-year sterling swap rates looking back to 1990. Even over a month, it would be a 1-in-1,000 event and over this period it is more likely that firms could take mitigating actions.
Taken together, these results suggest there currently appears to be no major systemic vulnerability arising from derivatives margin calls on non-banks.”
Sharpe World warning!
Figure 12: Stress Scenarios on NBFI Levered Derivatives

Source: Bloomberg Finance LP, DTCC Derivative Repository plc, FCA Alternative Investment Fund Managers Directive (AIFMD), Morningstar, ONS, Solvency II submissions, UnaVista Limited and Bank Calculations
In a November 2021 publication from the Financial Stability Board, titled “Enhancing the Resilience of Non-Bank Financial Intermediation”, we get this: https://www.fsb.org/wp-content/uploads/P011121.pdf
“The focus of the NBFI work programme in 2022 is to use the insights from analysis in particular areas to develop a systemic approach to NBFI. This work will be carried out within the FSB as well as by its member SSBs and international organisations, to ensure that relevant experiences and perspectives are brought to bear. The deliverables include stand-alone reports in specific areas of the programme and an overall progress report to the G20 in late 2022 with the main findings across different areas and policy proposals to address systemic risk in NBFI.”
We can’t wait to see the G20 progress report later this year!
And for a tidy summary of the current state of affairs, here is a fantastic piece prepared by the Bank of England to explain things to the UK Government: Bank of England Letter to Government on LDI situation;
https://committees.parliament.uk/publications/30136/documents/174584/default/
“LDI strategies enable DB pension funds to use leverage (i.e. to borrow) to increase their exposure to long-term gilts, while also holding riskier and higher-yielding assets such as equities in order to boost their returns.”
“The rise in yields caused the net asset value of LDI funds to fall significantly and their leverage to increase significantly, as explained above. The fall in net asset value was reflected in margin calls, which the LDI funds had to meet. In these circumstances the LDI funds had urgently to rebalance, either by selling gilts into an illiquid market or by asking their DB pension fund investors to provide more capital. In some LDI funds, the speed and scale of the moves in yield and consequent decline in net asset value far outpaced the ability of the DB pension fund investors to provide new capital in the time available.”
“It is important that we ensure that non-banks, particularly those that use leverage, are resilient to shocks. However, it should also be recognised that the scale and speed of repricing leading up to Wednesday 28 September far exceeded historical moves, and therefore exceeded price moves that are likely to have been part of risk management practices or regulatory stress tests”
Sharpe World + a whole bunch of moral hazard.
We found this 2014 note espousing the growth of sophisticated LDI schemes.
https://www.europeanpensions.net/ep/junjul14-looking-ldi
“LDI is driven to a large extent by the nature of the pension market and that varies completely from country to country,” says F&C Investments head of LDI Alex Soulsby. “Holland is a long way in front in terms of the take-up while the UK has been gaining momentum as an increasing number of schemes have realised the importance of looking at risks in terms of liabilities. These two countries though are fairly similar in the way they implement a strategy.”
That got us thinking what circumstances might currently exist in some of the other markets that were advanced and sophisticated in their pension ALM practices.
Figure 13: Dutch 10y Govt Bond Yield (white) and HICP yoy% (blue) vs ECB Deposit Rate (orange)

Source: Bloomberg
Figure 14: German 10y Bund Yield vs HICP yoy%

Source: Bloomberg
Just as with the Great Financial Crisis (GFC) and the facilitation of Sharpe World based regulatory risk and accounting practices in the banking system (ie. BIS Regulatory Capital/Basel I) in the eventual catastrophe, so too are accounting/regulatory guidelines critical in the build-up of uncapitalized tails in the NBFI world. In the case of the UK LDI fiasco, the key contributing accounting facilitator is IAS19. We have compiled this following grid of the various rules that were implemented post-GFC to try to help pensions around the world deal with the new world of lower-for-longer monetary policy-imposed interest rates.

Regular readers will be well aware that we here at Convex Strategies have done our part to keep folks informed on the regulatory ponderings as relates to the fragility imposed by the highly levered NBFI system. Below we link various Monthly Updates, as well as the relevant research notes, commencing with June 2020, where we have alerted readers to the concerns and efforts of various financial stability regulatory dignitaries (BIS, FED, FSB, G30, etc.).
Risk Update June 2020
“As was inevitable, and arguably intentional, much of the risk that may previously have been found on bank balance sheets, moved over to NBFI’s balance sheets. As the BIS report blandly states “the growth of pension funds, insurers and other NBFIs has far outpaced that of banks in recent years”. The Fed (and others) lowered rates and bought up assets to encourage animal spirits, and animal spirits is what they got. We have found ourselves in a world where, in order to maintain market stability, levered investment managers now need bailing out. As noted above, it is arguable whether or not Central Bank asset purchases, in particular the extension into more diverse credit assets, has done much to help employment, but it has certainly aided the levered fiduciary investment industry.”
Risk Update October 2020
“How is it that these players are allowed to impose risk on the stability of the entire system through their use of leverage? How have we let, what we like to call Agency Bias (ie fiduciaries who participate on the upside but not the downside), imperil the wellbeing of the entire financial universe yet again? Most simply put, by allowing, indeed mandating, that they use a risk methodology that benefits their asymmetric incentive structure to the detriment of end capital owners and society. It is not too much to say that the use of probabilistic, ergodic process, Gaussian based risk methodologies is destroying the world. Bluntly, Value at Risk (VaR) isn’t just wrong, it is dangerous and perhaps even more sinister than that.”
Risk Update November 2020
“It leaves us in a uniquely fragile environment, we would argue, where unprecedented levering of mis-measured risks necessitates extraordinary and endless policy support the world over.”
Risk Update April 2021
“As a quick aside, per the above, we refer you to the just released May 2021 Financial Stability Report from the Federal Reserve https://www.federalreserve.gov/publications/files/financial-stability-report-20210506.pdf. We would not dub it a “great read” but do find it a fine example of the ongoing effort to justify the endless extension of Moral Hazard. As we have noted frequently, the broadening of the umbrella to include nonbank financial institutions (NBFIs) continues with a couple of explicit notes;
“Although markets for short-term funding are now functioning normally, structural vulnerabilities at some nonbank financial institutions (NBFIs) could amplify shocks to the financial system in times of stress” “Measures of Hedge Fund leverage are somewhat above their historical averages, but the data available may not capture important risks from hedge funds or other leveraged funds.””
Risk Update July 2021
“In line with the Fed’s announcement, the G30 Working Group on Treasury Market Liquidity released their report “US Treasury Markets. Steps Towards Increased Resilience”. The working group was chaired by Timothy Geithner and included such other distinguished former senior Titanic officers as Bill Dudley, Mervyn King and Larry Summers.”
[As an aside, it is worth noting that just this week Ben Bernanke, the Captain of the Titanic, was awarded a Nobel Prize in recognition of his efforts to save a significant portion of the First Class passengers on that fated cruise. Current First Class passengers the world over cheered the result.]
The problem wasn’t exactly unknown, just tolerated. Such are the wonders of Sharpe World.
We often discuss the convenient benefit to fiduciaries of the codified acceptance of Sharpe World practices at the expense of end capital owners. The other elephant in that room is the impact that the imposition and universal adoption of Sharpe World principles has had on the ability to create, and find holders for, debt. In no rational investment world would capital owners hold massively proliferating amounts of near zero yielding fixed income securities, as the issuers of those securities, in the case of sovereign governments, extended their debt outstanding balances to and through 100% debt-to-GDP ratios. There can be little doubt that Sharpe World, with its magical sleight of hand that Fixed Income provides a portfolio benefit no matter the circumstance, has been a key driver of the absorption of this explosion of government debt.
Figure 15: Govt Debt to GDP: US (white), UK (blue), Canada (orange), France (purple)

Source: Bloomberg
That’s four out of seven of the G7 countries. Italy is a bit higher and Germany a bit lower. The seventh country, Japan, is on a different scale.
Figure 16: Japan Debt to GDP

Source: CEICDATA.COM
This is what we are getting at when we ask, “what about the 40?” Who is going to hold all of this debt when its role as a portfolio balance is laid bare as a mathematical fraud? How much of this was absorbed under the auspices of being “risk reducing”, and further so through the application of leverage by fiduciaries in banks, pensions, insurance companies, hedge funds, money managers? Only in the wonderment of Sharpe World, aided by the moral hazard of money printing safety nets provided by central bankers, could the world at large have imposed these levels of debt on hapless savers. Who is going to own it now?
The likely answer to that question is the same as the people that were the largest incremental buyers during the final surge through the 100% debt/GDP levels: the central banks.
Figure 17: Asset Holding by the Fed (gold), ECB (blue) and BOJ (purple)

Source: Bloomberg
This is the solution of the BOE, as the Sharpe World leverage hits levels where UK pensions can no longer sustain ownership of UK Gilts. This has been the solution multiple times throughout the rise of interest rates by the Bank of Korea and the Korean Ministry of Finance and Economics. This continues to be the “unlimited, every day, forever” practice of the BOJ.
Of course, as the BOJ knows well, and as the BOE is in the process of learning, once you destroy your credibility related to your price stability mandate, you must commit to buying all the bonds. That leads to some inevitable implications as to your currency value, at least for those that still operate in an open capital market environment.
The Fed, it would seem, might have figured this out better than the rest, or maybe the rest are simply idling in hopes that the Fed brings the imminently hoped for recession down upon us all. The Fed seems to have adopted the “protect the back end” strategy much more so than their global peers. In this strategy the goal is to pursue aggressively your price stability mandate in the front end of yield curves in order to keep the back end as inverted as possible in anticipation of the impending recession. Whatever it takes to protect the Sharpe World holders of duration risk, to avoid the LDI type of meltdown we have seen in the UK, is acceptable apparently.
Figure 18: US 10y Tsy Yield (white), Fed Funds Rate (orange) vs CPI yoy% (blue)

Source: Bloomberg
Figure 19: US 10yr Swap – US2yr Swap

Source: Bloomberg
The ECB does not seem to have figured this out.
Figure 20: EUR 10y Swap Rate vs Eurozone HICP yoy%

Source: Bloomberg
Figure 21: German Bund 10y Yield – German Bund 2y Yield

Source: Bloomberg
The failure to prudently “prevent” foregone control of their respective price stability measures, the inevitable outcome of decades of creating inflation in the form of endless money and credit fuelled by obscene monetary and fiscal excess, now leaves central banks and governments in the Catch-22 we endlessly discuss. If they can’t maintain/restore credibility in their bona fides as keepers of price stability, they risk triggering an unwind of the conveniently misrepresented risk across the realm of Sharpe World practitioners. If they raise rates too far, in their attempt to constrain inflation, they risk the exact same problem.
It is, as we so often discuss, a sandpile. Self-Organized Criticality. Complex Adaptive System.
Margaret Thatcher put it this way as she prepared to constrain the inflation monster that had been unleashed in the 1970s in a speech to the Conservative Party Conference on 10th October 1980:
“Inflation destroys nations and societies as surely as invading armies do. Inflation is the parent of unemployment. It is the unseen robber of those who have saved.
No policy which puts at risk the defeat of inflation—however great its short-term attraction—can be right.”
https://www.margaretthatcher.org/document/104431
From Mark Buchanan’s excellent work, “Ubiquity”, on the concept of Self-Organized Criticality:
“To understand why a single grain can trigger a cataclysm, one needs to understand the detailed structure of the pile not just in a small region, but over its entirety. And one needs to understand about those long fingers of instability that run through the pile. Only in this way can the historian gain a far deeper appreciation of the history – an appreciation not only of what happened, but of why something of that general character had to happen, and will undoubtedly happen again.”
It is a tough spot for the central planners. Is this the inevitable avalanche that restores the sandpile to a natural equilibrium? Will the foreseeable consequence of a multi-year experiment in 0% interest rates and QE, paired with the fantasy park dynamics of Sharpe World, lead to a mass exodus from the park, leaving the big question “who is going to own all the debt?” Is Sharpe World closing? Or, as seems to be the more common perspective, are “they” closing the exit gates of Sharpe World? Will they continue or resume buying unlimited amounts of debt to fund the otherwise fiscally unsustainable governments? Will we see ever increasing mandated recycling of domestic savings into financially repressed sovereign bond markets?
This gets into the necessary consideration of the “impossible trinity”. Countries can’t manipulate both interest rates and currency values, while maintaining open capital markets. To a certain extent, Sharpe World maths and regulation was a soft form of mandated saving’s capture, in essence a bribe to fiduciaries to absorb vast quantities of bonds heedless of the compounding destruction to end capital owners. If the Faustian Pact is exposed, as one after the next roller coaster car finds out the real-world implications of life outside of two standard-deviations, and everybody tries to leave Sharpe World, there is a global debt problem for which it is very difficult to fathom a solution. The closing of the exit gates, i.e. the imposition of capital controls to force domestic saving pools to remain and fund domestic debt, seems an increasingly likely choice.
That, of course, raises some thoughts about early mover advantages. Do you want to leave your retirement savings in the hands of a Sharpe World fiduciary? What about alternative stores of value? If the likes of the BOE are willing to intervene in capping long term bond yields at circa 5%, even as their own year-end CPI forecasts rise to 13%, it may make sense to consider stores of value other than the GBP. If the BOJ is willing to buy bonds “unlimited, every day, forever”, even as their own inflation measure approaches multi-decade highs (even before they reopened from their own extended Covid shutdowns), it may make sense to consider stores of value other than the JPY.
Figure 22: JGB 10y Yield (white). Japan CPI yoy% (blue). YCC 0.25% Peg (red dashed)

Source: Bloomberg
Figure 23: JGB 10y Yield (white). JPY 20y Swap (blue). USD/JPY FX Rate (orange). JPY 1y10y Swaption Vol (purple). YCC 0.25% Peg (red dashed)
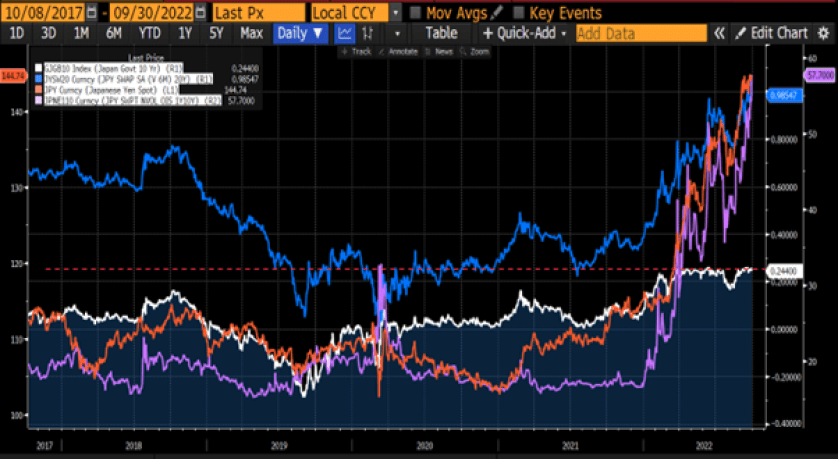
Source: Bloomberg
Figure 24: JGB 10y Yield (white). JPY 10y Swap (blue). USD 10y Swap (orange). EUR 10y Swap (purple)

Source: Bloomberg
Think of the white line, the JGB 10yr yield, as a beach ball that the BOJ is trying to hold below an arbitrary line they have drawn on the rocks of Tokyo Bay. The JPY 10y Swap rate is the surface level of the water in Tokyo Bay. The levels of the USD 10y swap and the EUR 10y swap are indicative to the general rise of sea levels around the globe. Lastly, things like the USD/JPY exchange rate and Japan CPI changes are indicative of the transmission from the global seas persistent rising onto the level of water in Tokyo Bay. It gets harder and harder to hold the beach ball in the same place under the rising water. When one lets go of a beach ball held ever further under water, it does not merely float to the surface. We say again, the most dangerous peg in the world.
How do investors navigate in what increasingly appears to be a world in the midst of a critical state phase transition?
We show it over and over. Even during the supposed “utopian age” for such Sharpe World favourites like Balanced 60/40 and Risk Parity, capital owners would have been much better off with a portfolio focused on improved convexity. Below we see the same old views, showing the superior convexity, superior return distribution, and far superior terminal outcomes when we compare the Sharpe World stars to our simple Always Good Weather (AGW) example of a Barbell Portfolio. These portfolios, for the chosen time horizon (we’ve chosen the “bull market period” commencing in March 2009), all have roughly equivalent historical downside deviation risk, and you could make a good argument that the AGW portfolio had better potential downside risk protection for risks that didn’t occur.
Figure 25: Always Good Weather 40/40/40 vs Balanced 60/40. March 2009 – Sept 2022 Scattergram and Return Distribution

Source: Convex Strategies
Figure 26: Always Good Weather 40/40/40 vs Balanced 60/40. March 2009 – September 2022. Compounding View

Source: Convex Strategies
Figure 27: Always Good Weather 40/40/40 vs Risk Parity Index (10vol). March 2009 – September 2022. Scattergram and Return Distribution

Source: Convex Strategies
Figure 28: Always Good Weather 40/40/40 vs Risk Parity Index (10vol). March 2009 – September 2022. Compounding View

Source: Convex Strategies
Anybody still functioning in Sharpe World needs to seriously consider how long they want to stick around the park. How do you know if you have funds trapped in Sharpe World? You will have folks referencing Annual Average Returns instead of Compounded Annual Growth Rates. You will have people measuring risk with things like Value at Risk, historical return volatility and historical stress scenarios instead of drawdowns, downside deviation, and heuristic stress scenarios. You will have people espousing Sharpe Ratio as an effective performance measurement. They will focus on forecasts, not payout functions. If you find yourself in any of those circumstances, it is past time to have a good think. Is the concept of Sharpe World closing based on it getting moth-balled because everybody is leaving? Or is the concept of Sharpe World closing the concept that the guys running the place will have no choice but to close the exits and keep everyone inside? Either way, how much longer can you afford to stay?
Read our Disclaimer by clicking here