‘Really it’s about getting the labor market back and getting it in shape. That’s been our major focus. I would say if we were to hold back because…we think asset prices are too high, others may not think so, but we just decided that that’s the case, what would happen to those people? What would happen to the people that we’re actually, legally supposed to be serving? We’re supposed to be pursuing maximum employment and stable prices, and that’s what we’re pursuing.‘ Federal Reserve Chairman Jerome Powell, June 10th 2020.
Not an unusual sentiment from policy makers, but is it correct? Are they right to decry each and every economic setback as being the result of some unforeseen exogenous shock, to then be followed by the same old prescription of even more of the same stimulus? Readers will of course be aware that we absolutely disagree. The true focus of policy makers should be around the endogenous risk that builds in the system, a risk which primarily they themselves create. Are they not simply bringing demand forward and leaving an ever bigger hole to fill in the future? Central Bankers need to ask themselves if their actions are what weaves fragility into the system that seemingly leads to ever greater dislocations, not to mention the destabilizing impact of ever greater wealth segregation. One wonders if the relentless expansion of the Fed’s balance sheet has really helped with Chair Powell’s stated objective of employment.
Figure 1: Federal Reserve Assets vs Continuing Unemployment Claims (Normalized)

Source: Bloomberg
It is probably safe to argue that the whole smorgasbord of balance sheet facilities offered by the Fed (and all the other Central Banks, for that matter) has less to do with their supposed employment and inflation mandates, but rather more to do with what they refer to as their Financial Stability objectives. A recent paper published under the BIS entitled “US dollar funding: an international perspective” (https://www.bis.org/publ/cgfs65.pdf) gives a little insight to Financial Stability concerns of the policy makers. The gist being, there is a whole bunch of leverage in the system and not necessarily just inside the banks. It is important to note that the paper was undertaken mostly prior to the Covid-19 market circumstances in late Q1, 2020. This paper, presumably, was spun up in relation to the ongoing support necessitated through the Fed’s interventions in the repo markets beginning back in September 2019, and then expanded to include the impact of the Covid-19 shutdowns.
In our sometimes cynical perspectives, we might portray this paper as laying the groundwork for why “they” had no choice but to bail out levered investment managers; what the report refers to as ‘Non-Bank Financial Institutions’ (NBFIs) and ‘Other Financial Intermediaries’. You’ve possibly heard us say before that the investment world has become one big LTCM, in other words a massive levered carry trade. It is not a big mental stretch to see this as the inevitable outcome of extreme monetary policy measures. The toxic brew of unprecedentedly low interest rates, historically unheard-of amounts of asset purchases, an express policy of incentivized moral hazard and all the flaws of regulatory and accounting guidelines could only ever lead to one place. That is a place of fragility on an unrivalled scale.
Figure 2: Intermediation of US Banks Balance Sheets

Source: BIS
As was inevitable, and arguably intentional, much of the risk that may previously have been found on bank balance sheets, moved over to NBFI’s balance sheets. As the BIS report blandly states “the growth of pension funds, insurers and other NBFIs has far outpaced that of banks in recent years”. The Fed (and others) lowered rates and bought up assets to encourage animal spirits, and animal spirits is what they got. We have found ourselves in a world where, in order to maintain market stability, levered investment managers now need bailing out. As noted above, it is arguable whether or not Central Bank asset purchases, in particular the extension into more diverse credit assets, has done much to help employment, but it has certainly aided the levered fiduciary investment industry. This, we believe, is what Chair Powell is so carefully talking around in his above quote.
This phenomenon of financial asset support, yet slumping real economy dynamics, has been the most common theme of discussion in markets of late. We have seen a variety of representations of this disconnect. One that quickly caught our eye was from the incomparable Albert Edwards, of Societe Generale fame, where he uses the 5 year percent change of US corporate profits as his proxy for real economic circumstances. We could not help but notice how similar that chart looked to our own favourite financial flows cyclical indicator of the SGD/JPY exchange rate, at least up till recently! The real economy is at its lows, but the financial flows are well supported.
Figure 3: US Corporate Profits 5yr % Change vs SGD/JPY

Source: Bloomberg, Convex Strategies
Another view of this disconnect is high yield corporate spreads and corporate debt issuance. Not to be repetitious, but the word unprecedented again comes to mind. It is hard to argue that the Fed’s interventions in corporate credit markets hasn’t had an impact.
Figure 4: US Corporate Debt Issuance vs US High Yield Spread
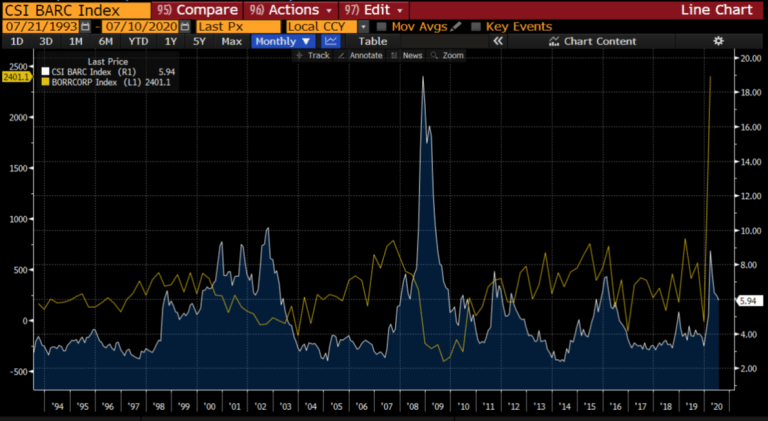
Source: Bloomberg
Has that intervention reduced the endogenous fragility of a system that was uniquely exposed to any sort of exogenous shock? Clearly the opposite we would say, particularly when we switch that corporate debt issuance view to the equivalent debt outstanding version (Figure 5), much less on a debt to GDP basis (Figure 6).
Figure 5: US Corporate Debt Outstanding

Source: Bloomberg
Figure 6: US Corporate Debt to US GDP

Source: Bloomberg
What does it all mean? The same as we keep talking about. The interventions by Central Banks and Governments, along with some sort of Covid solution, could turn the real economies around and all the extraordinary measures thrown at the markets could drive them to further and further record highs. Alternatively, the weight of the credit overhang on the system, coupled with the cash flow impact in the pandemic aftermath, could eventually see asset prices crash down to realign with economic fundamentals. The one thing that is clear is adding convexity to your investment portfolio is the right answer, at least if compounded returns is your objective.
To get further perspective on just how far out in Crazyland we currently are, have a glance at the below US M2 money supply chart. It is safe to say that the Fed is going for it. If/when anybody asks you “why the heck are equity prices up on the year”, you can point to this beauty.
Figure 7: US M2 Money Supply

Source: Bloomberg
Of course the Fed is not the only tenant on this island, and far from the most abusive. On a normalized basis the PBOC is putting them to shame over the last couple of decades.
Figure 8: US M2 (white) vs China M2 (orange), normalized

Source: Bloomberg
We’ve discussed it before, and many will remember, after the Fed’s initial reactions to the beginning of the last end-of-cycle unwind in August 2007, the likes of the China H-Share Index (HSCEI) in Hong Kong saw massive melt-ups. After dropping circa 25% in August 2007, the HSCEI proceeded to rally 100% over the ensuing months, only to subsequently drop again some 75% into the October 2008 lows. For those that, like many a hedge fund, might try to quote returns on an arithmetic basis, one might say – 25% + 100% – 75% = 0%. Of course in the real world of compounding capital that actually adds up to a return of -62.5%. This time round, after the 25% sell-off in March 2020, the HSCEI has thus far only bounced back circa 30%. Possibly another 70% upside left to be seen?
Figure 9: HSCEI Index 2007-2008

Source: Bloomberg
Figure 10: HSCEI Index 2020

Source: Bloomberg
Can Central Banks, and their ever closer relationship to their fiscal side partners, forever support asset prices through ever lower interest rates? Can the modern era Central Bank reaction function of driving rates lower to create the all critical negative correlation between fixed income and equity markets during times of market strife persist indefinitely, heedless of the absolute level of interest rates?
Figure 11: US Equity and Fixed Income Correlation vs US 10yr Treasury Yield

Source: Bloomberg, Convex Strategies
Figure 11 above details that correlation, overlaid with the level of US 10y Treasury yields, and makes it clear how it has worked for the last couple of decades. As rates rise, the correlation goes up (less negative, approaching positive), then Central Banks respond with policy moves (rate cuts, QE, forward guidance, etc.) to push rates lower and get that correlation to plunge back into max negative territory. Over time, however, as rates get ever lower, there can’t be as much negative correlation as there once was. Can they drive them sufficiently lower at the next equity market selloff to generate sufficient negative correlation? Inevitably, as Japan has shown, it is a losing, declining marginal benefit, game.
The asset management world, to an unimaginable extent, relies on this negative correlation for its Balanced Portfolio, aka 60/40, model. We will throw out, again, the quote from one of our favourite investors, “60/40 is dead”. We have shown here over and over again how a Barbell Portfolio (long equities / long volatility) has outperformed a Balanced Portfolio throughout the decline of that 10yr interest rate from 5.5% to 0.60%. At a starting point now of 0.60%, there is even greater confidence that a Barbell approach is the right thing to do. At a moment in investing history when the disconnect between financial valuations and the real economy have never been so extreme, it truly is a no-brainer.
Figure 12: SPX Correlation / Volatility Comet

Source: JP Morgan, Convex Strategies
Figure 13: SGD/JPY Cyclical / Seasonal Chart

Source: Bloomberg
Read our Disclaimer by clicking here