Way back in our June 2021 Update we noted the insistence of several central banks to stick with their historically extreme monetary policy settings, despite clear indication that their traditional metrics of economic circumstances were running at the hottest end of historical norms. We led off with this quote from the Poet Laureate of Economics, Bill White.
“The Fed says it will no longer react to anticipated higher inflation but only to actual higher inflation. Yet they are failing to react to actual higher inflation because they anticipate it will decline. Perhaps the real framework is anything that justifies not tightening?” Bill White; Financial Times, June 28, 2021.
https://www.ft.com/content/d313dc26-b87c-459d-86db-ac27f652693d
The culmination of this month’s BOJ Monetary Policy Meeting drove us back to the anchor that is Bill’s sage comment. Taking one particular paragraph from that 19-month-old note and playing the game of replacing the “Fed” with the “BOJ” generates this beauty that reads as though it sprang straight from a fresh review of the BOJ’s current status. (https://convex-strategies.com/2021/07/23/risk-update-june-2021/)
“Policy is set to continue to add as much additional juice to the economy as can possibly be provided, yet the supposed indicators they follow are running as hot as has been seen in decades. We are all meant to believe that these policies, which we were told were tailored to generate resurgence in their price stability measures during the worst of times, will now have no further impact, even the inverse effect, on those measures during booming times. Is the Fed BOJ admitting that their policies in fact do not impact the metrics that they have long claimed to be targeting? Is the Fed BOJ admitting that they have lied to us all along? Or is the Fed BOJ admitting that their policies have created so much fragility, so much moral hazard, so much dependence on the forever support of stimulus, that anything less than full-on will not be able to sustain it? Probably some amount of all-of-the-above.”
The BOJ announced, upon the culmination of their January Monetary Policy Meeting, a continuation of all aspects of their current extreme policy setting, plus the additional extension of their Term Lending Facility (aka “Funds-Supplying Operations against Pooled Collateral) from the 2yr, introduced at the December meeting, to now out to the 10yr point. For those struggling to keep up, let us recap what current BOJ Monetary Policy entails.
- BOJ Policy Rate of -0.10%.
- QQE that consists of regular and unscheduled Fixed Amount Rinban purchases across the entire JGB curve. At the December meeting they increased the amounts of the scheduled Fixed Amount Rinbans for Q1, 2023. Unscheduled and increased amount Rinbans can be announced any day at BOJ’s sole discretion. They also continue with scheduled ETF purchases.
- YCC explicitly targeted at maintaining the 10yr JGB yield at 0.00% with a +/-0.50% band and imposed by daily Fixed Rate Operations offered on unlimited size. Since the December meeting they have also included, at their discretion, unlimited Fixed Rate Operations on specified 2yr and 5yr bonds without any preset fixed rate target but rather just an announced rate on the day of the operation.
- Term Lending Facility against pooled collateral. This has existed for some time as a 2-week type of Discount Window. After the December meeting they started holding regular 2yr Lending Facility operations at a set rate of 0.00%. In the January meeting they announced an extension of this facility out to as much as 10 years with the operations being preannounced by the BOJ on specified terms and amounts. The rate, as opposed to the previous function of the 2yr facility, will be determined by auction.
They stuck with NIRP. They stuck with the increased level of QQE. They stuck with the revised implementation of YCC. And they aggressively upped the liquidity providing ability of the Term Lending Facility. They addressed the two key, and obviously related, technical glitches in the implementation of their policy; 1) There aren’t enough available bonds, net of the government issuance, to satisfy the hedging demand in the derivative space as rates rise, and 2) They were, inevitably and as we have been discussing for months, getting to the place where they owned all the available/eligible bonds. Their policy adjustment in January addressed these technical issues and cleared the path for them to continue to achieve what seemingly now is their singular objective, that of keeping interest rates low.
Post their “restoring market function” efforts in December (see our Dec 2022 Update here https://convex-strategies.com/2023/01/17/risk-update-december-2022-restoring-market-function/), and circa $140bn worth of bond and lending facility support in the month of December, they needed another roughly $260bn worth of freshly burned JPY injected through Fixed Amount Rinbans (scheduled and unscheduled), Fixed Rate Operations, and Term Lending Facility provision to keep the market functioning. BOJ is taking our Criticality Indicator, ie. “If it doesn’t work, do more. If it does work, do more.” to a whole new extreme. For some perspective, the ECB just announced that as of March they would be commencing their effort at QT to the tune of allowing EUR 15bn of runoff per month.
The Term Lending Facility is the solution to the dilemma we discussed last month, getting the private financial institutions to step in and buy the bonds. As opposed to, as we contemplated, giving banks preferential capital treatment to get them to buy the bonds, they have decided to give the banks subsidized funding. It is the bazooka of all bazookas in the evolution of QE/QQE/YCC. Their past efforts were limited by the issuance of the government and the sparsely, otherwise available, eligible bonds in the secondary market. The pooled collateral nature of the, now out to 10 year term, lending facility opens up the money printing for the entire outstanding pool of JGBs, along with the broad swath of other eligible collateral. In essence, the BOJ has given themselves the capacity to create freshly printed subsidized funding to virtually the scale of the current outstanding balance sheet of the Japan banking system. This opens the window for the BOJ to transfer potentially all their bond holdings and purchasing desires onto the banking system’s balance sheet.
This certainly solves their technical problem of not having enough bonds to buy, and clearly enables them to keep interest rates low, indefinitely. But, for what purpose? Is the purpose really to stimulate still greater increases in their chosen measures of price stability? As we incessantly ask, what if it works?
Figure 1: Japan (white) and Tokyo (purple) CPI yoy%

Source: Bloomberg
Many supporters of the ongoing policy extremism base their arguments on the core premise that said policies have not contributed to the current surge in prices nor will they manage to sustain these surges even into the very near future. Readers can peruse for themselves some of the (undoubtedly carefully edited) opinions that were stated by various participants at the most recent Monetary Policy Meeting.
https://www.boj.or.jp/en/mopo/mpmsche_minu/opinion_2023/opi230118.pdf
As some simple examples from those that appear to fall into the “it won’t work” camp, we give you these:
“The year-on-year rate of increase in the import price index has decelerated clearly, and upward pressure of costs, which has driven price rises, has started to wane.”
“The year-on-year rate of increase in the CPI is expected to fall below 2 percent from fiscal 2023, and at this point, there is still a long way to go to achieve the price stability target.”
“CPI inflation is expected to fall below 2 percent after upward pressure of costs diminishes. In order to achieve the price stability target of 2 percent, it is necessary that underlying inflation, particularly for services, rise sufficiently thereafter in reflection of nominal wage increases.”
Our good friends at Wigram Capital Advisors were kind enough to let us share the below visual of their 10% Trimmed Mean Tokyo CPI. We would opine that it shows a somewhat different view of circumstances to the ones noted by the above BOJ members.
Figure 2: WCA 10% Trimmed Mean Tokyo CPI yoy % and Six-mth Annualised

Source: Wigram Capital Advisors & CEIC
The Trimmed Mean methodology would seem to indicate that the price rises are broad based, not merely import price driven, and that said increases are not waning, quite the opposite, based on the 6mth annualized rate.
For some additional perspective, we can consider the, often stressed by BOJ, need for wages to catch up, with specificity around the necessity to achieve 3% wage growth in order to sustain their 2% price stability target. Any regular follower of Japan has heard this time and again.
We now have the December 2022 Monthly Cash Earnings numbers, and the 3% threshold has been well and truly pierced. Many an economy would be impressed with a 4.8% yoy wage increase.
Figure 3: Japan Avg Monthly Cash Earning yoy% (white). Tokyo CPI yoy% (papaya). JGB 2yr Yield (blue). 3% Wage Increase Threshold (red dashed)
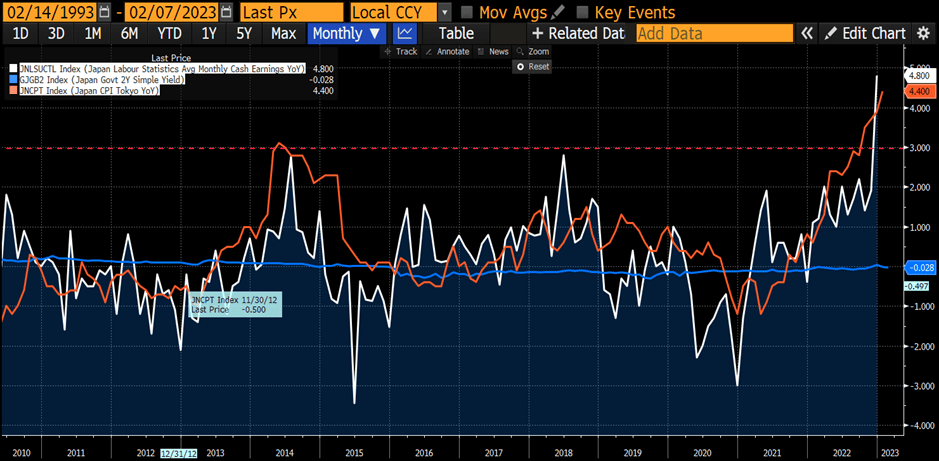
Source: Bloomberg
What if it works?
Not particularly germane, but worth noting, the last time Japan’s price stability measures pierced the 4% level, the respective JGB yields on 2yr and 10yr bonds were 8.50% and 8.25%. Today those two yields stand at circa -2bp and 50bp, respectively.
Figure 4: JGB Yields 2yr (blue) and 10yr (papaya). CPI yoy% Japan (purple) and Tokyo (white)

Source: Bloomberg
We reluctantly add this link to a speech given by Governor Kuroda at the end of last year. It is pretty standard stuff, basically Kuroda explaining why their policies haven’t worked, won’t work, and why, therefore, they have to keep doing them.
“The Bank of Japan aims at achieving the price stability target in a sustainable and stable manner, accompanied by wage increases. Today, I would like to talk about economic activity and prices in Japan and the recent conduct of monetary policy based on their developments, and then discuss in detail the characteristics of the labor market and wage formation in Japan.”
https://www.boj.or.jp/en/about/press/koen_2022/ko221226a.htm
Why is the BOJ insistent that there is no linkage between their policies and underlying economic circumstances? Why do they seem deadset on maintaining ultra-low interest rates, no matter the situation? One obvious guess comes back to the circa 260% of government Debt-to-GDP. This returns to the previous globally popular refrain for all of the central banks, “they can’t let rates go up”. We have seen lately this chart from the St. Louis Fed’s website showing the budget implications on US interest rate payments from the 2022 rise in interest rates.
Figure 5: US Govt Interest Payments through Q4 2022

Source: https://fred.stlouisfed.org/series/A091RC1Q027SBEA
Problematic, to say the least.
One can imagine what the equivalent for Japan, at more than twice the Debt-to-GDP of the US, would look like were interest rates to endure a similar rise. We saw some early projections out of the MOF back in Q3, 2022, when they announced a rare increase to the assumed interest rate for the subsequent fiscal year.
Per this article, the MOF raised their assumed interest rate to 1.3% from 1.2%, resulting in a 10.9% increase in their requested allocation for debt servicing, up to a revised JPY26.9tn.
Below is a chart from the annual Debt Management Report, which is a very comprehensive report and worth reading. The chart of annual Debt-related expenditures is from March 2022 and the 2022 bar is the projection for, what was then, the coming fiscal year. You can see that was projected at JPY24.3tn, but without the assumed interest rate. We should get the update on this towards the end of Q1. Per the above moderate increase in the assumed rate for fiscal 2023, it is safe to say that there is plenty of sensitivity to interest rates.
Figure 6: Japan Govt Debt-related Expenditures

Source:https://www.mof.go.jp/english/policy/jgbs/publication/debt_management_report/2022/esaimu2022.pdf
The increases noted in the above article are where things stand with the BOJ still operating on a negative policy rate, maximum QQE, unlimited YCC across multiple points of the bond curve, and the new extended 10yr Lending Facility. Even with all of that, the MOF is dialing up its assumed interest cost to the tune of a 10.9% annual increase in debt servicing costs. That increase of 10bp in the assumed interest rate was in August, months before the widening of the YCC band and another 25bp adjustment of the yield curve higher. We can’t know for sure, but we suspect this is why the stalwart supporters of the extreme monetary accommodation are adamant that IT WILL NOT WORK! So, they are sticking with it.
Just as we have commented about other debt trapped central banks, we assume Japanese interest rates will go up when BOJ decides they want them to. If the BOJ is anything like the rest, they will leave it till far too late and have to make far more adjustment than would have previously been considered necessary, or even possible. Everything under the sun, Ecclesiastes, 1-9.
In the meantime, it appears the BOJ is holding out with their strategy of hope. Hope that the Fed leads the world into the immaculate recession. Hope that the Fed’s efforts to aggressively tighten their own policy rate will be enough to take the steam out of inflation measures globally.
The recent decline in the rate of upward momentum in the US CPI Index has fueled the perspective that the Fed’s tightening efforts are starting to bite. PIVOT!™
Figure 7: US CPI yoy% (white). Fed Funds Rate (blue)

Source: Bloomberg
This has even brought back a revived chorus from the “transitory” crowd. Before tumbling into an argument about just how far and how long something can go before “transitory” becomes misrepresentative language, we think it is simpler just to adapt the visualization to the compounded view of the actual CPI Index.
Figure 8: US CPI Index (white). 2% per annum trend line (red dashed). Normalized

Source: Bloomberg, Convex Strategies.
Looked at this way, there is nothing “transitory” about the ongoing effort to weaken purchasing power of the dollar. “Persistent” might be a better word, in general, and “accelerating”, in the most recent phase, post the policy excesses from March 2020 onward.
In our above-mentioned June 2021 Update, we linked to an article that briefly discussed the infamous Federal Reserve FOMC meeting of July 1996. The infamy of this particular meeting results from the discussion that took place, after the normal monetary policy mumbo jumbo, that initiated the Fed’s move towards establishing an explicit price stability target. We link here the full transcript from that meeting. It is a fascinating read, revealing the level of theoretical and empirical sophistication (or lack thereof) that ultimately went into what would become the 2% (persistent) inflation/”price stability” target.
https://www.federalreserve.gov/monetarypolicy/files/FOMC19960703meeting.pdf
We will take some liberty and give a very quick, undoubtedly biased, summary of how we see this discussion. While generally we would not recommend people going through the pain of reading full FOMC transcripts, if you have ever wondered where the magical world of 2% price stability targeting originated from, this is a must read.
The special discussion around the concept of pursuing a price stability target commences on page 41 with Chair Greenspan kicking it off with this:
“The next item on our agenda–the issue of long-term inflation goals–is something that we have been discussing on and off for a long while, and I think we will continue to do so. It is important that we move forward on this issue and more specifically that we agree on what the goals mean before we can find some consensus within the Committee regarding their implementation.”
He then turns it over to, what we assume, are the respective representatives from the two sides, for and against, the concept.
First, representing the argument against an explicit price stability target (“long-term inflation goal”) is then Governor Janet Yellen. Taking the lead for the pro argument is Richmond Fed President J. Alfred Broaddus, Jr.
Governor Yellen makes the case that, were there to be a target, it in essence should not be less than 2%. This is where her famous “greasing-the-wheels argument” gets made, where she argues that the purpose of targeting some persistent low level of inflation is to incentivize employment without the less intelligent workforce being cognizant of the perpetual real debasement of their earnings. She specifically notes, to laughter from the group, that economists, as an employee group in the referenced survey, were not ignorant to this real debasement. We will take great leeway and simplify her argument, in order to get to a spot where the dissenting sides can move forwards, as that she is ok with the concept as long as it isn’t targeting something lower than 2%.
Governor Yellen:
“First, a little inflation permits real interest rates to become negative on the rare occasions when required to counter a recession. This could be important, and I think the current situation in Japan provides a textbook example of the difficulties in stimulating an economy that is experiencing deflation. Even with nominal short-term rates at .5 percent, real short-term rates cannot fall into the needed negative territory.”
“Second, and to my mind the most important argument for some low inflation rate, is the “greasing-the-wheels argument” on the grounds that a little inflation lowers unemployment by facilitating adjustments in relative pay in a world where individuals deeply dislike nominal pay cuts.”
Next, President Broaddus makes what amounts to an effort to progress consensus support for the ongoing discussion. He simply asks that all parties, before getting into more specifics, should be able to support something that confirms an effort at keeping some measure of inflation below 3%.
President Broaddus:
“This may involve some risks, but I would assert that there are, or at least there may be, some points of agreement. I think most of us would accept the view that at a minimum we want to hold the line on inflation–that is, to preserve the gains we have made over the last 15 years or so in bringing the trend inflation rate down and then to bring the rate down at least somewhat further over a period of time.”
“Most of us would like to avoid a situation where the underlying trend rate of inflation moves back up significantly over 3 percent for any length of time.”
“I would argue that agreement on these points–holding the line on inflation at 3 percent and subsequently bringing the rate down further–would at least be a start.”
At the risk of being overly dismissive, what we got here was a bartered negotiation that narrowed the range of the eventual effort down to both sides being willing to further discuss the issue as long at the inflation target was at least 2% but not more than 3%.
Eventually the argument as to if they can move forward with the discussion zeroes in on the definition and level of “price stability”. Chairman Greenspan defines it thusly:
“Price stability is that state in which expected changes in the general price level do not effectively alter business or household decisions……I would say the number is zero, if inflation is properly measured.”
But Governor Yellen sticks to her 2% level.
This is where, what we would consider one of the heroes of the meeting, Cleveland Fed President Jerry Jordan, speaks up with the below comment challenging the closing support around the concessions of 2-3% being the aim of a price stability target.
President Jordan:
“…one of the surveys I would want to conduct is to ask people as we approach the end of this century to choose between two things. If the central bank had an objective of reducing the purchasing power of the dollar to 13 cents or 7 cents over the next century, which would you prefer? I would expect the majority of the responses to be, why are you going to reduce it at all? Explain to me why the dollar is not going to purchase the same at the end of the next century as it does today. The difference between 13 cents and 7 cents is the difference between a 2 percent rate of inflation and a 3 percent rate of inflation over 100 years. I think most people would view that as a silly alternative. They would say, why not zero inflation.”
The other relevant hero, arguably the most rational speaker of all, was NY Fed President and FOMC Vice Chair William McDonough. He wisely stresses two points. First, price stability is a means to an end, that being sustained economic growth (Goodhart’s Law-esque), and second, the gathered discussants are likely not the correct body to be solidifying this as a mandated goal.
Vice Chair McDonough:
“…I think price stability is a means to an end, and the end is sustained economic growth…”
“I think the people who should decide that price stability, hopefully as a means to an end, is the appropriate goal of monetary policy are not the people sitting around this table. Rather, it should be the American people through their representatives in the Congress.”
The discussion carries on, bouncing from one member to the next, and eventually it just sort of evolves into an acceptance that 2% is the generally accepted target. Not for much of any reason, or even for any agreed specific measure, but just because those that would have argued favorably for a price stability target are willing to concede it to placate those less so inclined. From there, so goes the future of central banking for the world.
Lest some think we are being too unfair, we give you the below link to an interview done by our friend Danielle DiMartino Booth with our spiritual guru, William White. For those that enjoy the genre, stop whatever you are doing and press play. This is about the most valuable use of an hour you will find.
Keep a pen and pad handy because Bill throws out quality quote after quality quote. Per our above discussion, we particularly liked this one from Bill.
“The 2% thing was totally arbitrary. There was no really serious economic logic that went into the choice of 2%.”
Arbitrary or not, we would argue it has played a major role in the buildup of the sandpile of economic and financial circumstances that we currently find ourselves navigating. Back in our July 2022 Update https://convex-strategies.com/2022/08/16/risk-update-july-2022/ we linked to a paper by UK based economist Ricardo Reis and shared the below image from his work on the very long history of UK CPI Inflation.
Figure 9: Eight Hundred Years of Inflation in the United Kingdom, 1217 to 2016

Source: https://personal.lse.ac.uk/reisr/papers/22-whypi.pdf /Millenium dataset of the Bank of England.
The obvious point that we emphasised in our comments around this wonderful scatterplot of the historical means and volatilities of CPI Inflation, was the anomaly of the most recent dot, for the period 1997-2016. Commencing just after the above noted FOMC meeting, the BOE who climbed upon the same price stability targeting wagon, absolutely nailed it for two decades. A distribution of the historical outcomes would show the 1997-2016 period to be in the lowest possible percentile in terms of both its divergence from a 2% target, as well as the lowest absolute level of volatility of the measure overall.
We now have just six years of realizations into the next 20yr period and have done our own calculations to determine where the current dot resides. We highlight that with the red dot and red arrow below.
Figure 10: Eight Hundred Years of Inflation in the United Kingdom, 1217 to 2016. Revised with 2017-2022

Source: https://personal.lse.ac.uk/reisr/papers/22-whypi.pdf /Millenium dataset of the Bank of England.
Being cognizant that most of the initial 3 years of our new period continued along the lines of the previous regime, while the current revived enthusiasm of the CPI measures really has occurred in the most recent 3 year stretch, we went ahead and created a dot to represent the mean and volatility for just 2020-2022. We show that below with the gold dot and the blue arrow.
Figure 11: Eight Hundred Years of Inflation in the United Kingdom, 1217 to 2016. Revised with 2017-2022 and 2020-2022

Source: https://personal.lse.ac.uk/reisr/papers/22-whypi.pdf /Millenium dataset of the Bank of England.
Most will have heard us say, usually as advice to any willing-to-listen central bankers, “without price stability, there can be no stability”. We would argue, and history would seem to support, the foregone price stability tends to reverberate to economic instability, interest rate instability, asset price instability, and even socio-political instability. Are we witnessing a Minsky-esque environment where a long period of (artificially imposed) stability begets a subsequent period of instability? After more than two decades of central banks targeting a persistent level of a minimum measure of inflation, resulting in an unprecedented (truly) low volatility of their inflation measure, now that the measure is (rather rapidly) diverging are we more likely to mean-revert back towards the most recent anomalous period or are we in the early legs of a sustained dislocation? Could we, in fact, be reverting to something more in line with all of history with significantly higher divergence from target at much higher levels of volatility?
A couple of guys that have opined on this topic are Charles Goodhart and Manoj Pradhan in their 2019 book “The Great Demographic Revival. Ageing Societies, Waning Inequality, and an Inflation Revival”. For observers of long-term trends, this is a must read. The authors (and note, they wrote this in 2019, ahead of all that has since transpired) challenge many of the fundamental orthodoxies about what ageing and declining populations may entail for future inflation.
The gist of their premise is that ageing populations, combined with declining working age populations, particularly in Advanced Economies, will lead to labour shortages and a structural increase in inflation. Their argument extends to a supposition that not only will nominal rates need to keep up with the rising levels of inflation, but that the extended period we have been through of negative real interest rates, while likely needing to initially extend even further into negative space, will eventually have to reverse and we should move into a sustained period that necessitates positive real rates.
The authors conclude with a section on the “debt trap” nature of the challenge that stands ahead. Though they don’t really get into it, one can’t help but ponder the question of “who is going to own the 40?” as you read through their analysis. To summarize, it is a sandpile.
“The extended leverage in the global economy is the biggest impediment to the normalisation of interest rates, and of the economy more widely, that demographics will ultimately deliver.”
Charles penned a recent article on the topic, as well as some thoughts as to the immediate challenges of policy makers that you can see here.
https://iai.tv/articles/the-real-cause-of-inflation-auid-2045
“We have to avoid falling into a new recession. Yet if we are to pussy-foot so gently in raising interest rates, we may find ourselves unable to prevent a wage/price spiral from developing and speeding up. Not an easy time to be on a Monetary Policy Committee. Finding a margin between worse inflation on one hand and recession on the other will be a horrendously difficult exercise.”
Charles and Manoj paint a very good case that the above diverging dot of the mean and volatility of CPI Inflation is likely to continue to a) rise upward as the volatility of inflation expands, and b) to diverge from its “targeted” mean, likely in both directions.
Foregone price stability will be hard to restore in the complex demographic, and historic debt-trapped, environment we find ourselves in. Past stability very likely will beget future instability.
The amazing thing, even if you had designed an investment strategy to benefit from the unique inflation environment of the previous couple of decades, you still would have underperformed an equivalent risk strategy that embedded convexity that benefitted from volatility.
We are not sure which way around it goes. Were Sharpe World based strategies constructed to benefit from the rarest of a low volatility inflation environment, or were low volatility inflation environments constructed to benefit Sharpe World based investment strategies? Either way, as Nassim Taleb titles this most excellent piece, “Understanding is a Poor Substitute for Convexity”.
https://www.edge.org/conversation/understanding-is-a-poor-substitute-for-convexity-antifragility
“Optionality frees us from the straightjacket of direction, predictions, plans, and narratives.”
Convexity benefits from uncertainty. Shannon’s Entropy. Jensen’s Inequality. Payout Function: ‘x’ vs ‘f(x)’. We have explained it in so many ways.
It is easy to compare any of our theoretical positively convex barbell strategies against any example of Sharpe World (supposedly) efficient portfolios, starting with ‘Always Good Weather’ 40% Nasdaq, 40% S&P, 40% CBOE Eurekahedge Long Vol Index versus a Risk Parity portfolio.
Figure 12: AGW 40/40/40 vs Risk Parity (max drawdown equalized). Scattergram and Return Distribution

Source: Convex Strategies, Bloomberg
Figure 13: AGW 40/40/40 vs Risk Parity (max drawdown equalized). Compounding View

Source: Convex Strategies, Bloomberg
Or our Dream Portfolio of 60% S&P, 20% Gold, and 40% Long Vol versus a Balanced Portfolio.
Figure 14: Dream Portfolio 60/20/40 vs Balanced Portfolio 50/50 (Downside Deviation Adjusted). Scattergram and Return Distribution

Source: Convex Strategies, Bloomberg
Figure 15: Dream Portfolio 60/20/40 vs Balanced Portfolio 50/50 (Downside Deviation Adjusted). Compounding View

Source: Convex Strategies, Bloomberg
Or a Private Equity Barbell of 70% P/E Index and 60% Long Vol versus the Endowment Index.
Figure 16: P/E Barbell 70/60 vs Endowment Index (Downside Deviation Adjusted). Scattergram and Return Distribution

Source: Convex Strategies, Bloomberg
Figure 17: P/E Barbell 70/60 vs Endowment Index (Downside Deviation Adjusted). Compounding View

Source: Convex Strategies, Bloomberg
In all the above examples, the Sharpe World based strategies, explicitly designed to thrive during the period of suppressed CPI inflation volatility (2005-2019 in these examples), were consistently outperformed by risk-equivalent Convex Barbell strategies. As the world moved into a regime of increased CPI volatility (2020-2022), the true superiority of the more convex portfolios really comes to light. If central banks manage to regain control of their price stability measures and we return to an environment of 2% average CPI and very low volatility, we think that you will likely still achieve better risk adjusted compounded returns built with an emphasis on convexity and the principles of “Participate and Protect”. If, on the other hand, we are moving into a regime, more akin to pretty much all of past history, where the battle to suppress the volatility of inflation measures runs head-on into the “debt trap” fragility of a post ZIRP, NIRP, QE, QQE, YCC manipulated system, we think convexity should only prove to be even more valuable.
Read our Disclaimer by clicking here