Like many, our attention this month was drawn towards a non-market related set of events. The US 20-year war in Afghanistan finally came to an end. What really got our attention can be visualized by the time-lapse map embedded in the BBC link below.
https://www.bbc.com/news/world-asia-57933979
For ease, we’ve cut and pasted a series of the maps in succession. Their nature is self-explanatory.
Figure 1: Time-lapse of Afghanistan Provincial Control 2021


Of no surprise to those familiar with the concept, the dynamics around the culmination of the US war in Afghanistan perfectly displayed the characteristics of self-organized criticality (SOC), aka ‘sandpile theory’. If you have read Per Bak’s opus “How Nature Works” (if you haven’t, we strongly suggest you do), you will recognize the similarity to the pictures generated from the computerized sandpile game after a series of avalanches has occurred. The solid blue portion is the area where avalanches have toppled the previous piles of sand.
Figure 2: Sandpiles and Avalanches

For 20 years the US Government/Military suppressed volatility, propped up a faux equilibrium sandpile, only to have it flatten completely in literally a matter of days. It is a classic example of what in thermodynamics would be called a phase transition, or in evolutionary biology a punctuated equilibrium. An extended period of stasis organised into a critical state, with fingers of instability running throughout, that then triggers into a catastrophic series of connected avalanches. What we would call a fat-tailed, power law distribution, just like our oft-referenced Yellowstone Park fire analogy.
Bak puts it nicely in sandpile terms: “The sandpile goes from one configuration to another, not gradually, but by means of catastrophic avalanches. Because of the power law statistics, most of the topplings are associated with large avalanches. The much more frequent small avalanches do not add up to much.” He further notes: “If we try to prevent avalanches by putting up local barriers, ‘snow screens’, here and there, this would have a similar effect and for a while the avalanches would be smaller, but eventually the slope will become steep enough to overcome the barriers, by forcing more sand to flow somewhere else.” One might call these second-order effects or, in economic jargon, negative externalities.
We spend most of our time thinking/talking/writing about imbalances, trying to understand what fingers of instability may be running through complex systems like economies and markets. Invariably, we get to see the implications of critical state behaviours throughout the real world as well. There is a reason Bak named his book “How Nature Works”. A likewise appropriately named book is called “Ubiquity: Why Catastrophes Happen” by Mark Buchanan. It is a book about Bak’s concepts and also very much worth a read. A quick definition of the word “ubiquity” would be something like “appearing everywhere”. In one section of Buchanan’s book, he talks about supercriticality and indeed uses the Yellowstone Park fire as an example. In discussing modelling of forest fires, he summarizes the results simply as “when the fire-starting frequency was very low, the game showed a marked tendency to catastrophic, all-consuming disasters.”
The current purveyors of extreme monetary policy at the Federal Reserve will generally claim that their policies are focused on the objectives, as redefined in just over the last year or so, of maximum employment and an average rate of change of the PCE Core Deflator (their chosen, very narrow, measure of inflation) of not less than 2%. We, on the other hand, would argue that their policies were enacted, sustained, expanded, and adapted in order to avoid sweeping issues of insolvency. The real issue is what they would call financial stability but what we refer to as ‘uncapitalized tails’. No doubt, mass insolvency and instability would have a deleterious impact on their stated goals of employment and rising prices. As we quoted Bill White (who we have dubbed the Poet Laureate of Economists) back in our October 2020 Update (https://convex-strategies.com/2020/11/19/risk-update-october-2020/), “the policy regime has encouraged the belief that economies face liquidity problems when the underlying problem is really one of insolvency” thus “the path we are on is unsustainable because the underlying problems grow worse over time while the solutions become more constrained” – i.e. a sandpile. If indeed the underlying issue is one of insolvency, in other words too much risk and leverage relative to the loss absorbing capital in the system, how can addressing it with policies (ie. more cheap leverage and moral hazard) that adds more risk and leverage to the system, be a sustainable solution? That solution would seem to entail a necessity of permanence; if it doesn’t work, do more, and if it does work, do more.
The debt trap that they have created leads to the common refrain that “they (central banks) cannot let interest rates go up”. We regularly point out the potential sensitivity to the market of central banks releasing their iron-grip on interest rates. Of course, we are always discussing this as a risk, ie. something that hurts if it were to happen, not per se as a view of some sort. The push back we get (though none would argue that it wouldn’t hurt, so we presume they are discussing a view and not a risk) is simply “why would they let that happen?”. We generally counter that “presumably because they decided to”. This brings us back to the analogy with Afghanistan. Why would the US do something that would end up allowing the Taliban to overtake the entire country? Presumably because they decided to. To be clear, we are not making political points nor blind to the danger to people in that country, or making light of the impact to investors in the event of market turmoil. Our point is around risk and fragility in complex systems.
US President Biden lays it all out rather clearly in the below speech from July 8th, 2021 and deliberately the first map of Afghanistan above is from July 9th, 2021.
With what we now know in hindsight, we are left with the usual dichotomy: are they stupid or are they in on it? Dumb or deluding? President Biden assures us that their narrowly defined dual mandate of getting Osama Bin Laden and preventing Afghanistan from becoming a base for future attacks has been achieved: “We accomplished both of those objectives – period”. He also noted that after a decade (2001-2011) of troop surges, the US had declared it was over and commenced a taper from 2011 targeted for completion in 2014. This carried on with various stops and starts, time and again requiring a reversal of troop drawdowns to restabilize the sandpile, until the terminal withdrawal in August 2021.
Figure 3: 20 Years of Afghanistan Troop Injections and Tapers

He explains the undeniable logic that permanency of a US Military presence, the recognition that the propping up of the imbalance necessitates “being there indefinitely”, is justification for the decision to fully withdraw. Interestingly, he notes that the Taliban “is at its strongest military since 2001”. The fingers of instability were far from unknown. He even admits to learning from the past, claiming he “will not send another generation of Americans to war in Afghanistan with no reasonable expectation of achieving a different outcome”.
He assured us that they were leaving behind a well-trained and extraordinarily well-equipped Afghan National Security Force meaning that “the likelihood there’s going to be the Taliban overrunning everything and owning the whole country is highly unlikely”, thus “they clearly have the capacity to sustain the government in place”.
We know now that President Biden was either flat ignorant as to the fragility of this particular sandpile, or he was being remarkably disingenuous just weeks before the Taliban would overrun the entire country. Or maybe it is simply that he and his cadre of advisors don’t understand how nature works.
In last month’s update (https://convex-strategies.com/2021/08/20/risk-update-july-2021/), we used Fed Chair Powell’s July 2021 FOMC press conference to give a number of examples of Orwellian ‘Newspeak’, where he outright redefined the usage of such words as transitory and broad. This month we have the pleasure of being able to refer to his August 2021 Jackson Hole speech but, before moving on to a review of that through the lens of self-organized criticality (SOC), we first want to throw in a quick quote from Chair Powell’s post-FOMC press conference from a year ago, July 2020 where the word inflation appears a mere 9 times, versus the July 2021 version where it shows up 86 times. In 2020 virtually all the references to inflation were of the perspective that it was too low. Most of the references related to just one question during the Q&A. To give you an appropriate level of confidence as to Chair Powell’s foresightfulness on this key subject, we append his answer below.
“In terms of inflation, I don’t know. I mean, I—you know, I think, fundamentally, this is a disinflationary shock. I know there—there is a lot of discussion about how this might lead to inflation over time, but, you know, we’re—we’re seeing disinflationary pressures around the world going into this. Now we see a big shock to demand, and we see core inflation dropping to 1 percent. And I do think for quite some time we’re going to be struggling against disinflationary pressures rather than against inflationary pressures.” Jerome Powell. FOMC Press Conference July 2020.
Figure 4: US CPI Y-o-Y% (Vertical Line = July 2020)

Now to Chair Powell’s Jackson Hole August 2021 speech, which we find remarkably similar in structure, from an SOC perspective, to President Biden’s July 2021 Afghanistan speech, except that Powell isn’t yet getting around to withdrawing the troops.
https://www.federalreserve.gov/newsevents/speech/files/powell20210827a.pdf
Figure 5: 14 Years of Federal Reserve QE Liquidity Injections and Tapers
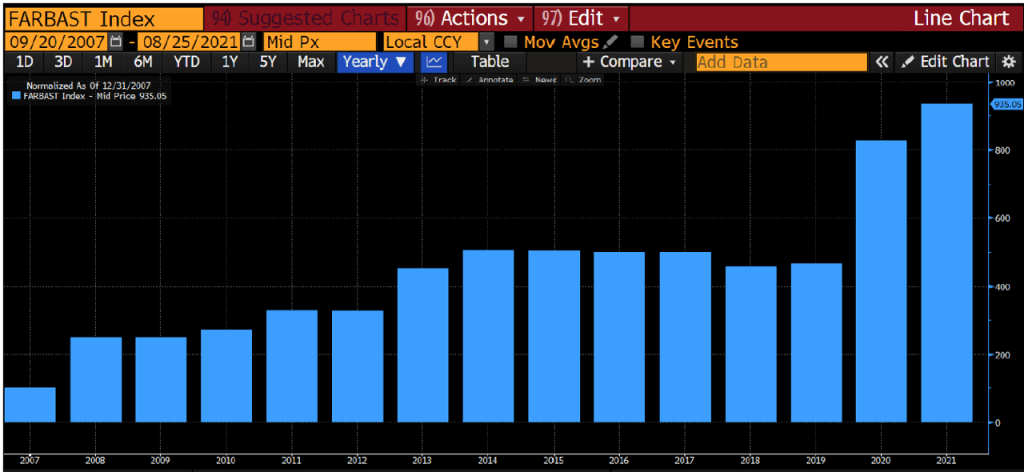
Chair Powell leads straight off with the classic misunderstanding (or is it misrepresentation?) of the relevance of history, opening his comments with “Seventeen months have passed since the US economy faced the full force of the COVID-19 pandemic”. The fragility of the US economy did not suddenly materialize in March 2020, no more so than the fragility of Afghanistan only arrived with Biden’s announcement of the final withdrawal date. In the world of sandpiles, history matters. Chair Powell mentions nothing about the last 14 years of QE surges, nor the aborted attempt at normalizing policy that was suddenly halted in late 2018, nor about the subsequent return to rate cuts and balance sheet expansion in 2019. Nope, history now starts with the pandemic.
Figure 6: US Financial Assets as % GDP + QE

https://www.aljazeera.com/news/2021/9/6/timeline-how-september-11-2001-led-to-uss-longest-war
Next, Chair Powell follows up with a discussion of the progress they have made on the path to achieving their stated dual objectives of employment growth – “the pace of total hiring is faster than at any time in recorded data” – and on rising prices – “well above our 2 percent longer-run objective”, ala President Biden’s claims of achieving their dual mandate in Afghanistan.
This is where the two speeches noticeably diverge. President Biden, having claimed success on their mandate (granted, 10yrs previously), explains why incurring the cost of pursuing their interventions further has no benefit and firmly stands by the exit, while assuring all that the necessary wherewithal is in place to withstand a resurgent Taliban. Chair Powell, on the other hand, goes to great lengths to explain away the ever-growing overshoot in the target for rising prices. He assures listeners, and lays out five arguments, that while “inflation at these levels is, of course, a cause for concern” there are “a number of factors that suggest that these elevated readings are likely to be temporary”.
To slightly meander away from our SOC theme, we feel obliged to briefly run through Chair Powell’s five points as to why we should not believe our lying eyes as relates to various indications of what he refers to as inflation.
- The absence so far of broad-based inflation pressures: Chair Powell justifies this view by referencing a “trimmed mean” indicator, in particular the Dallas Fed Trimmed Mean. A couple of quick comments on this. First, we all wish we could remove from our essential purchase basket those items whose prices have risen the most! It is, in fact, the items that have risen the most that have the greatest impact. Second, funny how they never reference trimmed mean measures when they think ‘inflation’ is too low. One further note, it probably isn’t a coincidence that he used the Dallas Fed Trimmed Mean as opposed to the Cleveland Fed Trimmed Mean.
Figure 7: Federal Reserve Trimmed Mean Inflation: Cleveland Fed (white) and Dallas Fed (red)

- Moderating inflation in higher-inflation items: Here he points out the unusual, based on recent history, rise in durable goods prices relative to services prices. It is not clear what exactly in his referenced picture is meant to be not concerning.
Figure 8: Durable Goods vs Services Inflation

- Wages: He states that “Wage increases are essential to support a rising standard of living and are generally, of course, a welcome development”. Were we ever given the opportunity; we might point out that what he should reference is that real wage increases are essential to support a rising standard of living!
Figure 9: US Real Average Weekly Earning Y-o-Y%

- Longer-term inflation expectations: Again, we might be just a bit critical on the Chair’s selection of indicators. He has used the CIE, which as you can see below has a history of no sensitivity whatsoever. We’ve added in NY Fed’s Median 3yr Expectation number in red.
Figure 10: Fed Inflation Expectation Indices: NY Fed 3yr Median (red) and CIE (white)

- The prevalence of global disinflationary forces over the past quarter century: Here he notes that through much of recent history many advanced economies have been running with somewhat low inflation and “there is little reason to think they have reversed or abated”. Clearly, he is not versed in our previously mentioned concept of phase transitions. As the saying goes, a 5 foot tall person should not assume he can wade across a river with a 4 foot average depth.
Figure 11: Euro Zone HICP (white) and UK CPI (blue) Y-o-Y%

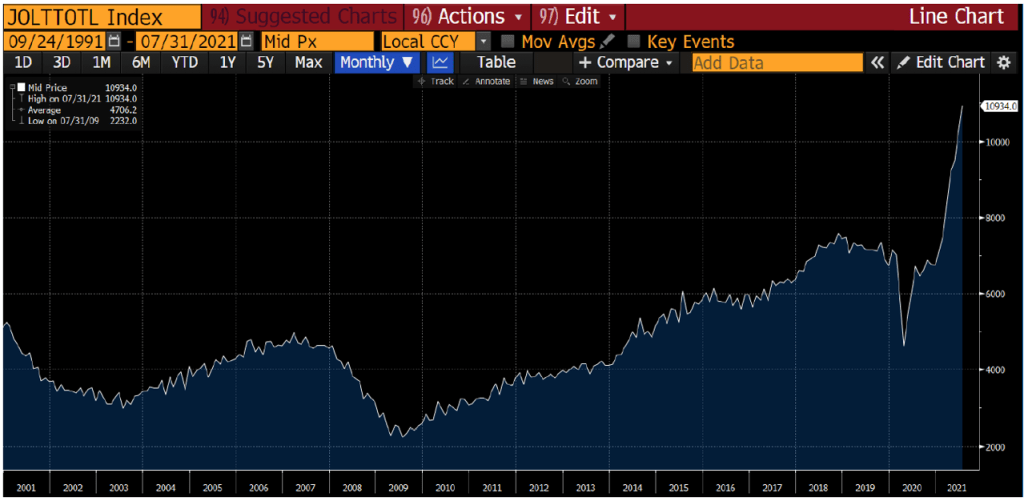
That nicely brings us back to our sandpile analogy. Chair Powell wraps up with some historical comments about distant times when the nature of the sandpiles may or may not have relevant comparisons to today’s circumstances. The one thing he never touches upon is the structural issue, what we have defined as solvency, that makes the current sandpile inherently fragile. He does, having spent the bulk of his presentation explaining it away, confess that one of his objectives, ‘inflation’, has met his test for “substantial further progress” and admits that at some unspecified future date they may feel the need to start a reduction in the pace at which liquidity is being injected into the economy. Not by any means a withdrawal of troops, just a slowing of their injection. For now, however, he intends to keep the heat on full, presumably waiting for his tsunami of liquidity to generate greater demand to employ people.
Figure 12: US Job Openings (JOLT Index)
The perfect SOC analogy here is the phase transition point as water moves from a steady equilibrium state to a critical state as heat is applied, then onto its phase transition as it hits the boiling state. We are all familiar with the never boiling “watched pot” that gets close to the boiling point, only to retreat from its critical state as you dump in the uncooked chopped potatoes. This is followed by the rookie mistake of cranking up the heat to max assuming that the return to the critical state will follow the same consistent linear path seen during the interminable minutes waiting for the pot to boil previously. This is where saying things like “on average over the previous 10 minutes it didn’t boil” and watching that short Youtube cat video can really get you in some trouble.
That critical state to phase transition looks like the maps of Afghanistan where, all of a sudden, parts of the map start flipping from one colour to another (critical state), then all to the same new colour (boiling). In an economic sense they might look like some of the above charts of rising price indices, or demand for workers, or they might look like the below chart of year-on-year changes in US Nominal GDP. For the longest time, the water didn’t boil. Each time we dropped something in the water (eg the Dotcom crash, the GFC, the Pandemic) the water moved away from its critical state. Each time we turned the heat up, convinced that the pot wouldn’t boil over because it hadn’t done so thus far. We’ve included in the below our proxy of the Fed’s policy setting, the Wu Xia Shadow Fed Funds Rate, which continues to be at max accommodation.
Figure 13: US Nominal GDP Y-o-Y% (white) and US Wu Xia Shadow Rate (red)

As with the US recognition that the structural fragility of Afghanistan would necessitate an indefinite presence, thus precipitating their total withdrawal, so too may the Fed eventually come to the same conclusion. John Taylor agrees with us, “But history tells us that it cannot continue indefinitely. Eventually, the Fed will have to return to a policy rule”
At some point, you wonder if the bubbling water will become more convincing than the previous 30-year average when the water didn’t boil? Are they blind to it? Or, as we suspect, are they just even more concerned about the, not to be mentioned, structural fragility of the sandpile? At what point, ala President Biden and his (misplaced) talking up of the capabilities of the Afghan National Security Forces, should we start to expect assurances that, even should the Fed withdraw their unprecedented monetary support, the market will be able to stand up to the pesky residual solvency fingers of instability? Of course, to some extent, we hear this all the time. We hear how, under Basel III, the banks are stronger and better capitalized than ever! Surely, they don’t need central banks to underwrite the values of the assets that they own. We hear of innovative new life rafts like the Standing Repo Facility that will smooth market function when central banks aren’t around to buy assets from over-levered holders. We hear of permanent standing swap-lines around the world. We hear of central clearing, new more sophisticated margining protocols, more and more reams of regulatory reporting and oversight. The financial system is well trained and well equipped to stand up against any of those un-surrendered solvency issues that may have survived the years of artificial support. Keep your ears open.
Of course, all of these security measures rely on the same flawed statistical methodologies that allowed the fueling of the solvency problem, the uncapitalized tails, in the first place. Yet another must read, if you haven’t already, is “The (Mis) Behavior of Markets” authored by the mathematician Benoit Mandelbrot. This is the foundation for the recognition of the power law and fractal nature of market returns and really the core backbone of all of Nassim Taleb’s fantastic works. It is Mandelbrot’s work that so clearly lays out the flaws, indeed dangers, of statistical methodologies that flow from the assumption that market prices behave in a Brownian motion manner and display the characteristics of a Gaussian or Normal distribution. They simply do not. Like sandpiles, earthquakes, and all the ubiquitous things in nature that self-organize to a critical state, market price returns display power law characteristics and are far riskier than can be explained using simple mean and variance models applied to assumed Normal probability distributions.
How important was Mandelbrot’s work? Well, according to Bak, “the importance of Mandelbrot’s work parallels that of Galileo, who observed that planets orbit the sun”. No small praise! Yet, few if any practitioners, academics, regulators, or policymakers seem even aware of his conclusions. Indeed, the entire undergirding of Basel III and all of its predecessors is a dangerously flawed use of Normal distributions and the related statistical methods. Again, perhaps Bak puts it best regarding Mandelbrot; “His findings have been largely ignored by economists, probably because they don’t have the faintest clue what is going on”.
Once you get into the SOC mindset, you start to see criticality in everything. As an example, we can extend the Afghan and economic analogies to the current pandemic circumstance. The structural fragility of the Taliban in the Afghan sandpile, and the insolvency in the economic sandpile, obviously, is taken up by the virus in the pandemic sandpile. Similarly, the interventions to protect and prop up the sandpile which were the US Military presence in Afghanistan and the provision of liquidity through QE and zero interest rates in today’s economic circumstance, equate to lockdown strategies imposed by those pursing the so-called “zero-Covid” policies. Think of all of them as bubbles to protect us from the structural dangers. The bubble protection strategies all share a similar flaw, they all inevitably tend towards indefiniteness. They create that false equilibrium that tends towards the critical state. If they don’t work, you do more. If they do work, you do more.
https://www.abc.net.au/news/2021-08-19/melbourne-200-days-of-covid-lockdowns-victoria/100386078
All pursuers of the zero-Covid policy know that they cannot sustain it indefinitely. The cost to government fiscal conditions to offset the impact of these policies would have been totally unimaginable a mere two years back. So, just like the training and arming of the Afghan National Security Forces, or like the greater regulatory rigors of Basel III, the sandpile managers search for the means to allow the system to protect itself once the unsustainable interventions reach their inevitable end. In the case of the virus, that protection is the mass rollout of vaccinations.
Figure 14: Global COVID-19 Vaccinations, Cases, Deaths

The development and rollout of vaccines has truly been without any historical equivalent. Unfortunately, for an absolute zero-Covid strategy post removing the bubble, there would need to be a 100% acceptance/usage rate and a 100% efficacy rate of the vaccine. Neither of those are realistic. Nevertheless, just as with Afghanistan, the interventions cannot go on forever. Hopefully, the vaccines do a better job of allowing for post-intervention stability of the pandemic sandpile than the well trained and armed Afghan National Security Forces did with the post-intervention Afghanistan sandpile. Time will tell. Likewise, we will just have to wait and see how Basel III and the other “protections” hold up if/when central banks ease up on their interventions. According to BofA’s Michael Hartnett, those interventions amount to having bought $834m of financial assets every 60 minutes since the outbreak of Covid-19. He also notes that combined monetary and fiscal stimulus since the pandemic equates to $32 trillion, contributing to an increase of global stock market capitalization of $57 trillion. Now that is inflation.
We raised it in our January 2021 Update (https://convex-strategies.com/2021/02/19/risk-update-january-2021/) stating that two big potential event risks looking forward were:
- The vaccine does not work. It certainly appears as if pricing in asset markets, across basically the entire swath of asset classes and geographies, continues to factor in strong recoveries as economies reopen. Despite continued start/stop lockdowns across much of the world, there is seemingly a strong belief that as the rollout of the vaccine extends things will quickly return to normal. If the vaccines turn out to be a disappointment in their efficacy, it could prove rather disappointing relative to current valuations.
- The vaccine does work. Policy settings, both for central banks and governments, are set on maximum potential support for economies. We are already seeing reflationary frictions around the globe. If the vaccine is a storming success, will policy makers pull back their unprecedented support before even greater dangers of inflation materialize? Will they be able to pull back said support as asset markets have already absorbed the past support into bubble-like levels?
It would seem the jury is still out and the sandpile continues to grow.
How does one deal with the complex adaptive sandpile world in managing investment portfolios? If you have read our thoughts previously you will know that we think investors should construct positively convex portfolios that “participate and protect”. The objective is to aggressively participate in their successful efforts of ever guiding the sandpile higher, joining in on the asset inflation that their firehose of liquidity drives ever upward, while simultaneously protecting against the fingers of instability that run throughout the sandpile that, inevitably, will contribute to some future chain reaction of avalanches.
We think of it like a Formula One race car. The most important thing on the car is THE BRAKES! The better the braking ability, the faster you can go between the sharp turns. A long race with multiple laps around a circuit is like the non-ergodic path of compounding. The objective is terminal capital, how you fare at the end of the 40 laps. If you make a critical mistake at one of the sharp turns, the negative compounding effect means you aren’t winning the race (possibly not even finishing it). The Kelly Criterion solution to this problem is to the reduce the speed capacity by only running the engine at 60% and forever holding 40% in reserve, call it the Balanced Racer. The better strategy is to invest in better brakes and go full throttle down the straight, the Barbell Racer. To the casual race fan, the Balanced Racer looks to be holding its own just fine over the 95% of the circuit where there are gentle curves and few straights but, every time the cars go through the fastest 5% of the circuit with the longest straights followed by the sharpest curves, aka “the wings”, the Barbell Racer surges ahead. The results look like the compounding charts we posted last month, with our Always Good Weather Portfolio (40/40/40) playing the role of the Barbell Racer and S&P Risk Parity (10% Target Vol) chiming in as the Balanced Racer.
Figure 15: Barbell Racer (blue) vs Balanced Racer (red): 13 Laps In. 27 Laps to Go.

Figure 16: Barbell Racer vs Balanced Racer: Ratio of Lap Standing. 13 Laps in. 27 Laps to Go.

Not even halfway through our hypothetical 40-year compounding race and the Barbell Racer has already nearly lapped the competition. For the Racer that underperforms on the most critical parts of the circuit, there is really no hope of ever catching up. When you throw in the self-organizing criticality nature of the circuit that we are running this race on, the benefits of better brakes and faster engines gets increasingly relevant. Sandpiles in their critical state don’t easily return to a natural equilibrium. One last quote to wrap it up:
“Self-organized criticality is a law of nature for which there is no dispensation”. Per Bak, “How Nature Works”
Read our Disclaimer by clicking here