“Those whose job it is to manage risk today tend to focus on the things to which probabilities can be attached and shrug their shoulders about everything else.” Niall Feguson, Oct. 2023.
Decent note from historian Niall Ferguson in Bloomberg this month. He touches on the issue of unintended consequences and applies some familiar sarcasm to the issue: “Nobody could have predicted the Treasury market’s collapse of the last two years – apart from every critic of artificially low interest rates since John Locke.” It is a shame that he never explicitly refers to Sharpe World.
Worst Bond Collapse in 150 Years Caused by Unintended Consequences – Bloomberg
We touched on this topic in some detail in our April 2022 Update, “How did they expect it would end up?” https://convex-strategies.com/2022/05/19/risk-update-april-2022/. We put it this way at the time:
“Seriously, how did they expect it would end up? How did central bankers think years and years of ZIRP, NIRP, QE, Twist, Liquidity Facilities, QQE, YCC, etc would end? Did they honestly not expect it to inevitably come to a terminus with the system maximally fragile to higher interest rates? Were they not at least slightly suspicious that, at exactly peak financialization, there might be a risk that the need to normalize policy would inevitably appear? One could surely argue that this very end-state was so obviously inevitable that it was precisely their intention. If it doesn’t work, do more. If it works, do more.”
For the definitive discussion on this topic, we again refer readers to Edward Chancellor’s unparalleled work, “The Price of Time”. In it he references Friederich Hayek: “Monetary policy directed at stabilizing prices, said Hayek, ‘administers an excessive stimulus to the expansion of output as costs of production fall, and thus regularly makes a later fall in prices with a simultaneous contraction of output unavoidable.’ The future Nobel laureate wrote those words in 1928.”
Going back to the above note from Niall Feguson, he points to some of those feeling the pain of rising yields, dubbing it “the biggest bond market rout in 150 years” and noting where some of the suffering resides.
“All this is terrible news for the banks holding large quantities of Treasury securities on their balance sheets. It is terrible news for the very large number of companies whose investment grade bonds – totaling more than $400 billion – mature next year. It is terrible news for anyone looking to refinance a mortgage. For all these different groups, borrowing will leap upwards…. But the biggest consequence will be for the biggest borrower – namely the US government.”
While we generally agree with Niall’s sentiment, we would encourage him to split his categories into the two obvious divisions, namely borrowers and lenders. As we often point out, the borrower is long the option. It is the lender that is taking the risk. Thus, his first line above, as relates to the large quantities of Treasury securities held by banks, we strongly agree with. Though, again, we would expand that to any large holders, in particular those functioning under the smoke-and-mirrors of Sharpe World methodologies/regulations. As to the final line, assigning the biggest consequence to the US government, we don’t necessarily buy into and will come back to it later in the note.
It is precisely this massive uncapitalized tail, what we have generically dubbed the “40” (our proxy for all the misrepresented fixed income holdings inside Sharpe World based institutions and investment portfolios), that leads us to our question “who is going to own the 40?”. The ultimate scary outcome of this dilemma is taking the world down the unthinkable path of what we have christened ‘The Great Stop Loss’.
We wrote at some length of two (as of then) notable victims in the grind of ‘The Great Stop Loss’, those being FDIC insured and SF Fed supervised Silicon Valley Bank (SVB) as well as member of the exclusive G-SIB (Globally Systemically Important Bank) club Credit Suisse (CS), in our March 2023 Update – “Probability vs Possibility” (https://convex-strategies.com/2023/04/14/risk-update-march-2023-probability-vs-possibility/).
We quoted former Kansas Federal Reserve President, Thomas Hoenig, twice in that Update.
“The market no longer determines what is adequate capital for the banking industry. Following generations of taxpayer support and government involvement, politicians, regulators, and lobbyists have supplanted the market in determining what counts as capital, how it is calculated, and how much is enough. This artificial mechanism has resulted in a decline of both the level and the quality of capital among the world’s largest banks.” Thomas Hoenig, March 2023.
“The regulatory authorities need to stop pretending that their complex and confusing capital models work; they don’t.” Thomas Hoenig, March 2023.
Mr. Hoenig, like ourselves, isn’t of a mind to leave these issues unnoted. He recently testified in front of a Congressional subcommittee. Here are his prepared remarks:
Basel Risk-Weighted Capital Standards: History of Poor Outcomes | Mercatus Center
Simply put, Tom is advocating for the use of a ‘Leverage Ratio’ (LR) versus the current ongoing Basel prescribed ‘Risk Weighted Asset Ratio’ (RWC). He points to, amongst other flaws, the politization of the RWC standard to direct credit to special interest areas. Readers will be aware that we strongly agree with this sentiment and the inevitable unintended consequences.
“An inherent problem with a RWC standard is that the weights are static, reflect past events, and too often are adjusted by supervisory judgement. This introduces political and special interests into the process misdirects capital and may incorrectly favor one group of assets over another. For example, in the past low weights were assigned to high-risk sovereign debt, collateralized debt obligations (CDOs), and derivatives, encouraging growth in these assets while discouraging loans on assets assigned higher risk-weights such as commercial and industrial loans.” Thomas Hoenig, November 2023.
As we always state, banks don’t go out of business taking risks that they capitalize but, rather, they go out of business holding too many supposedly riskless assets that they don’t capitalize. This is a short and simple presentation, nicely framed for a Congressional hearing, which everybody should try to give a quick read.
In his comments, Tom references and footnotes a speech that was delivered by former Bank of England senior staffer, Andrew Haldane, at the 2012 Jackon Hole Symposium titled “The Dog and the Frisbee”. Many friends of ours will have received links to this note from us over the years. It may be the single best speech ever given by a modern-era practicing central banker. It is not, however, a short and simple read. It is a rabbit-hole that we could be drawn into for the entirety of an Update, and more. We will skip digging into it just now, maybe try to come back to it in a future Update, but link here for readers to peruse for themselves.
Andrew G Haldane: The dog and the frisbee (bis.org)
We got a peak in October into what we might term the ‘poster child’ of ‘The Great Stop Loss’ when Bank of America (BAC) released their Q3 earnings.
Bank of America’s unrealized losses on securities rose to $131.6 bln | Reuters
The Reuters article on the BAC earnings announcement notes that they reported “unrealized losses of $131.6 billion on securities in the third quarter”, but conveniently “the bank does not expect the portfolio to generate actual losses in the long-term.” That expectation comes from a direct quote courtesy of BAC’s own chief financial officer who claims, “because we’re holding them to maturity, we will anticipate that we’ll have zero losses over time.”
In Sharpe World one can assume away the potential of higher funding costs over the life of your duration-mismatched securities portfolio, even in a world of 5.5% Fed Funds rate and $600+ billion of securities that would seem to be accruing interest earnings at a yield far lower than that. We suppose that we might accept that they won’t be ‘forced’ to sell these low-yielding securities, if we buy into the notion that depositors would never flee a major US G-SIB in search of market competitive interest rates and better capitalized institutions.
On that topic, taking a look at BAC’s June 30, 2023 Basel Pillar 3 Disclosures (2Q23 Basel 3 Advanced Pillar 3 Disclosure Final – ADA (d1io3yog0oux5.cloudfront.net)), we can get some sense of their capital adequacy.
Figure 1: Bank of America Corp June 2023 Basel Pillar 3 Regulator Capital

Source: Pillar 3 Regulatory Capital Disclosures : Bank of America Corporation (BAC)
We won’t bother to reconstruct the whole grid but will just note that the Supplementary Leverage Ratio (SLR), the equivalent of the Leverage Ratio that Mr. Hoenig discusses above, is the Tier 1 Capital divided by the Supplementary Leverage Exposure (aka total assets). So, for the far-right column, that is 217,249 divided by 3,640,382 which equals the 6% ratio in the bottom right corner. If one were to recalculate that but applied the unrealised hold-to-maturity losses against the Tier 1 Capital number, you would get circa (217,249 – 131,600) = 85,649 divided by 3,640,382, for an adjusted SLR of 2.4%. Hmmmm.
Of course, there is always some possibility that they, themselves, choose to sell and/or hedge the interest rate risk. The potential logic for this could maybe be represented by comparing the performance of their share price against that of a competitor that is also mentioned in the Reuters note, JP Morgan (JPM), and noted as having a mere $40 billion of their own unrealized losses.
Figure 2: BAC and JPM Share Price Performance. Normalized. Nov’22-Nov’23

Source: Bloomberg. Convex Strategies.
We have no idea what the likes of the BAC CFO, or other senior management, operate under in terms of KPIs (Key Performance Indicators) but we can imagine there could be some pressure to stop this rot at some point. Maybe.
Lest readers think we are the only ones that keep harping on about this issue, and sometimes it does feel that way, we direct your attention to the latest “Report to the Secretary of the Treasury from the Treasury Borrowing Advisory Committee (TBAC)” and the accompanying presentation “Explaining the recent market moves across the Treasury yield curve”.
TBACCharge1Q42023.pdf (treasury.gov)
Here is the link should anybody want to be reminded of the esteemed Sharpe World institutions that make up TBAC. Treasury Borrowing Advisory Committee Members | U.S. Department of the Treasury
This report, while touching on many of the usual suspects in its attempt to explain rising longer-term yields, does eventually home in on the issue at hand. We’ve quoted the relevant full paragraphs to keep things in context but have highlighted in bold what we think are some of the key points.
“Demand for US Treasuries may have softened among several traditional buyers. Bank security portfolio assets have been declining since last year with bank holdings of Treasuries down $154 billion compared to one year ago. The appreciation of the US dollar means some foreign central banks may consider liquidating Treasury securities in the process of defending their currencies. Anecdotally, some investors had expected that ten-year Treasury yields would not rise beyond the approximately 4.25% high of last year and had already extended the duration of their fixed-income portfolios – meaning they now have limited capacity to add more interest rate exposure. Investors who own mortgages or callable debt have had their duration exposure mechanically increase as higher interest rates mean slower rates of repayment. Treasury auctions continue to be consistently oversubscribed but there may be some early evidence of waning demand. On October 12th a reopening of the thirty-year bond auctioned 3.7bp cheaper than the prevailing rate before the auction, the largest ‘tail’ in a thirty-year bond auction since 2021.”
“Dealers explicitly noted a high degree of uncertainty overall around deficit and growth forecasts, reinforcing Treasury’s need to maintain flexibility in their issuance strategy.”
“The Committee discussed this in detail, focusing on the unusual confluence of strong growth and high issuance, and debated to what extent strong Q3 growth exacerbated the moves. It was noted that estimates of Quantitative Tightening (QT) and increased interest expense could contribute to the local increased procyclicality between the two. Members also highlighted that the less negative correlation we have seen recently between Treasuries and risk assets has contributed to the rise in term premium. There was an agreement that shifts in Fed expectation have contributed to the rise in longer term yield, both due to changed expectation for the policy path and for the lengthened anticipated timing of the end of QT. However, there was consensus that shifts in Fed expectations have only had a limited pass-through into longer term yields. Additionally, the view was that the scale of this incremental QT was not significant relative to the scale of supply and updated fiscal outlooks.”
“Both Charges highlighted the recent shift to more price sensitive investors that we have seen in US Treasury demand, with household (which includes hedge funds) absorbing the majority of the recent increases. Effectively, while there is still reasonable demand for US Treasuries from many domestic and international market participants, it has not kept pace with the increase in supply. This has been somewhat offset by strong demand from money market funds, both as a shift from the Overnight Reverse Repurchase Facility (ON RRP) and on an absolute basis. Both charges also highlighted the continued reasonable market functioning, given the scale of the recent moves.”
“Ultimately, the Committee’s second charge highlighted the importance of retaining flexibility in issuance strategy within the Treasury’s regular and predictable framework. The charge suggested Treasury consider skewing increases in issuance towards tenors which have less sensitivity to term premium increases, and ones that benefit from greater liquidity. The Committee supported meaningful deviation from the historical recommendation for 15-25% T-Bill share. While most members supported a return to within the recommended band over time, the Committee noted that the work Treasury has done to meaningfully increase WAM over the past 15 years affords them increased flexibility with T-Bill share in the medium term.”
Allow us to translate: ‘Who is going to own the 40?’ Or as Mr. Creosote, of Monty Python fame, so eloquently put it, “Fu@k off! I’m full.”
The accompanying presentation is full of wonderful charts. Definitely worth a quick skim through. The one below shows their point about who the only willing buyers have been, what they term as ‘price sensitive investors’, aka households (including hedge funds). We would assume ‘price sensitive’ entails some combination of skin-in-the-game and folks with mark-to-market accounting treatment. Most of the other buckets (eg. Fed, Banks, Insurance, Pensions, Foreigners) generally don’t fall into either of those categories. Further, it is worth considering the relative access to leverage of the categories. While households and hedge funds may have access to some leverage, they come nowhere close to the leverage a bank can apply on a 0% RWA, or that which a Pension Fund can utilize in a Liability Driven Investment or Risk Parity type of portfolio construct.
Figure 3: TBAC Report on Treasury Buyers Q3 2022 – Q2 2023

Source: TBAC Report, Federal Reserve
We can see that banks have indeed been fairly active in reducing their holdings of Treasuries and Mortgage-Backed Securities (MBS).
Figure 4: US Bank QoQ Change in Debt Securities Held

Source: TBAC Report, FDIC
If we jump briefly to the October 2023 Financial Stability Report from the Federal Reserve, we get a clear sense of why the TBAC report claims some investors may have “limited capacity to add more interest rate exposure”.
Financial Stability Report October 2023 (federalreserve.gov)
Figure 5: US Bank Fair Value of Securities Portfolios

Source: Federal Reserve Financial Stability Report October 2023
On a quick aside, this report includes the below graphic with the following comment:
“An alternative measure of bank capital is the ratio of tangible common equity to total tangible assets. The tangible common equity ratio has similarities to the CET1 ratio in that both exclude intangible items such as goodwill from the measurement of capital, but there are also important differences between the two. In contrast to the CET1, the tangible common equity ratio does not account for the riskiness of assets, but it does include fair value declines on AFS securities for all banks. The tangible common equity ratio edged up across all bank categories in the first half of the year, especially at G-SIBs. Nonetheless, it remained at a level well below its average over the past decade, partly due to a substantial drop in tangible equity from declines in fair value of Treasury and agency guaranteed mortgage-back securities in AFS portfolios.”
Figure 6: US Banks Tangible Leverage Ratio

Source: Federal Reserve Financial Stability Report October 2023
We think it is worth noting that, unlike our quick and dirty calculation above for BAC, the creators of this report didn’t think it worthwhile to include a version that also factors in the Held-to-Maturity securities. Presumably they don’t think that has any implications for financial stability.
The Fed wasn’t the only central bank to touch on the financial stability issue in October. Freshly anointed RBA Governor, Michelle Bullock, gave her first speech since stepping into the new role; “Monetary Policy in Australia: Complementarities and Trade-offs”.
Monetary Policy in Australia: Complementarities and Trade-offs | Speeches | RBA
This is a nice speech, very aligned to the current thinking in the realms of central bankers. She discusses the trade-offs and complementarities between their price stability and employment mandates and sticks with their long-stated hope of restoring the former without any negative impact on the latter. She then goes into a lengthy dissertation of the, what we might call a newly re-prioritized, financial stability mandate.
Ms. Bullock notes that “most of the time, the RBA’s financial stability objective is intrinsically linked and complementary to its objectives for inflation and employment.” She then echoes the concerns of our current times.
“However, there are times when what is needed to achieve full employment and low inflation may not be ideal for maintaining financial stability. For example, an extended period of accommodative monetary policy to lift employment and inflation can contribute to the build-up of leverage and imprudent risk-taking in parts of the financial system. A sharp tightening in monetary policy at a later point to control inflation can then expose these vulnerabilities.”
Something they are all considering.
Back to the TBAC presentation, they show a clear picture of the declining share of ownership by foreign holders of Treasuries.
Figure 7: Foreign Official Holdings of US Treasuries, % of outstanding

Source: TBAC Report, Federal Reserve, US Treasury
We think that this is better understood when compared to the absolute levels of the foreign holdings. The point being that it isn’t exactly that foreigners have stopped buying but, rather, that the pace of their buying isn’t keeping up with the pace of supply.
Figure 8: US Treasury Major Foreign Holders

Source: Bloomberg
Fortunately, for all those with limited capacity to hold more duration assets, the Treasury Secretary listened to their cries.
The Quarterly Refunding Statement surprised, and pleased, the market with both an overall reduction in expected issuance and, more importantly, a reduction in the expected issuance of longer dated coupon securities. Still, it is no small amount to digest.
Figure 9: Actual and Projected Treasury Auction Sizes Aug’23 – Jan’24

Source: US Treasury Quarterly Refunding Statement
At this point in many a conversation, we get asked if we are crazy and if we are suggesting that Treasury Secretary Yellen will somehow fail to make good on her outstanding debt, somehow fail to raise the funds she needs to rollover her maturing piles of previously issued bonds, or fail to fund her ongoing trillions of fresh fiscal deficits. And we say, of course not!
In what is increasingly becoming “The Hunger Games” of tapping the dwindling marginal supply of liquidity in the system, we fully expect Secretary Yellen to play the role of Katniss Everdeen, with a near certainty of teaming up with her present-day Peeta, if things ever get out of hand, in the form of Fed Chair Jerome Powell. Janet will secure her funding, one way or another.
The risk in this scenario is to everyone else, who also have historically large piles of debt to refinance at levels of interest rates now far different to what existed just a couple of years ago. This problem appears at a time when traditional holders, eg. Sharpe World institutions, are already choking on the existing unprecedented stock of debt, the risk of which has not only been vastly under-capitalized due to financial repression based regulatory risk constructs, but also aligned with accounting requirements that have allowed vast unrealized losses to accumulate to solvency-impeding scales.
“May the odds be ever in your favour.”
Katniss always wins. At least with a little help from Peeta.
This is why we have been saying that, and central banks have been hoping for, the ‘good outcome’ would be that they (‘they’ broadly being central banks but, in particular, the Fed) get us to the recession, asset markets crash, and everybody willingly buys their bonds. The ‘bad outcome’ is any other scenario where nobody buys their bonds. We put it this way in last month’s Update https://convex-strategies.com/2023/10/17/risk-update-september-2023-wait-for-it/:
“We have long been of the opinion that central bankers would be best served by keeping the curves inverted, limiting the pain of unrecognized duration losses on the Sharpe World entities holding all their bonds, until they got to the recession they seem to desire and, thus, limit any curve steepening to the far more common bull steepening dynamic. In other words, get to the recession so the market would willingly continue to buy and hold the bonds. A failure to vanquish the inflation beast, thus raising yet further deterioration of monetary and fiscal credibility, brings us back to the unmanageable dilemma of nobody wants to own the ‘40’.”
In line with falling year-on-year price indices and some moderate upticks in unemployment rates, a fairly strong narrative around imminent, if not already present, recession has spread of late. The result has been, as we mentioned last month, a proliferation of ‘pauses’ in further rate hikes by central banks, now including the ECB who paused at their most recent meeting after a steady series of hikes since they commenced back in July 2022.
The obvious argument for those calling not just for a pause but for more or less immediate rate cuts in the Eurozone can quite easily be seen in the year-on-year change in, for example, The Netherlands HICP price index.
Figure 10: Netherland HICP YoY%. Jan 1997 – Oct 2023

Source: Bloomberg
The HICP index had a YoY% change of -1.0% in October. Deflation! Cut rates!
But, as we like to do, showing the compounded version of the index itself shows a somewhat different view. Looking at it this way, one is probably less likely to scream about the terrifying deflation over the last year.
Figure 11: Netherland HICP Index Jan 1997 – Oct 2023

Source: Bloomberg
Taking the January 2023 low point of the index, we can see that since then the index has risen 4.3% from then through October 2023, rising at an annualized rate of circa 5.8%, so not exactly ‘deflation’. For further perspective, in the year from January 2021 to January 2022 the index rose 8.4% and from January 2020 to January 2021 it rose 7.6%. En passant, from January 2016 through October 2023 the index rose a cumulative 32.17%, or at an annualized rate of 3.66%.
Figure 12: Netherland HICP Index Jan 1997 – Oct 2023

Source: Bloomberg, Convex Strategies
Even the naked eye can see that from November onwards, particularly from January, the index is higher than its year before realizations. We have plotted out below what subsequent YoY% reports might look like, come January 2024, if there is 0% additional inflation over the next three months (yellow line) or if we continue at the current January 2023 to October 2023 annualized run rate of circa 5.8% (red line). We will see how long the cries of deflation persist.
Figure 13: Netherland HICP YoY%. Jan 2017 – Oct 2023 (white). Projections for Nov’23-Jan’24 at 0% (yellow) and 5.80% per annum (red)

Source: Bloomberg, Convex Strategies
There has no doubt been plenty of enthusiasm across markets as we crossed over from October to November and the narrative around the pending recessions gathered momentum. One of the things that we can’t help but wonder is, if the ‘good outcome’ can come about in an ‘anticipated recession’ scenario where market participants buy all asset classes in anticipation of relaxed monetary tightening by central banks, will that be enough, in the longer run, to really get folks to willingly buy their bonds? Will the Utopian ‘Soft Landing’ be enough? Or will equity markets also need to be sacrificed like any other tribute in the Games?
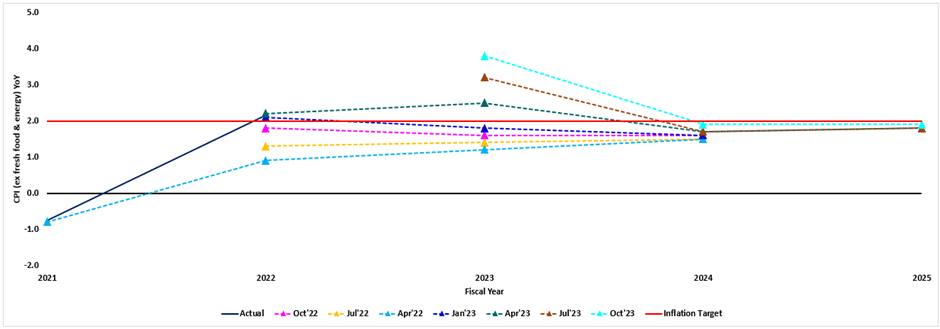
Of course, critical to this whole evolving sandpile are the last major providers of liquidity into the Hunger Games battle pit, the Bank of Japan. As has been obvious since their last quarterly projections, they came through with a significant revision higher for their FY’23 CPI ex-Fresh Food and Energy forecast, raising the forecast from the previous July projections of 3.2% to a revised 3.8% as of the October meeting.
Figure 14: History of BOJ Quarterly Forecasts for CPI ex-Fresh Food and Energy
Source: Bank of Japan, Convex Strategies
The realized YoY% readings since the start of the fiscal year, in April, are putting more and more pressure on them to revise up the FY’23 projections. As you can see from figure 14, it is having no impact on their FY’24 and FY’25 projections. Still, with only 5 months remaining in their averaged series, they are not exactly brimming with confidence as to the efficacy of their accommodative policy stance.
Figure 15: Japan CPI ex-Fresh Food and Energy YoY% (white) and Estimated Future Path to Achieve BOJ Oct 2023 FY’23 Forecast (multi-coloured)

Source: Bloomberg, Convex Strategies
For some perspective, this is how it looked after their July projections.
Figure 16: Japan CPI ex-Fresh Food and Energy (white) and Estimated Future Path to Achieve BOJ July 2023 FY’23 Forecast (multicoloured)

Source: Bloomberg, Convex Strategies
Along with these revised forecasts, which are still officially not sufficient to deem as having reached BOJ’s 2% target, Governor Ueda gave us another tweak in the YCC mechanism. At the July meeting, they adjusted the previous YCC hard ceiling on 10yr JGBs at 0.50% to a ‘reference rate’ and moved the hard ceiling to 1%. At the October meeting, the 1% hard ceiling was downgraded to now itself being the ‘reference rate’. In essence, YCC is no more. Rather, as we have recommended from the beginning, they will merely engage in the market as and when they feel like it. No more lines in the sand. Took a while, but it is probably a good idea.
We doubt it is enough.
Figure 17: Japan CPI ex-Fresh Food and Energy YoY% (white). $/JPY Rate (orange). JGB 2yr Yield (blue)

Source: Bloomberg
The world is fragile. Stability begets instability. What does one do?
We listened to a fantastic recent episode of the Grant Williams Podcast, with Peter Atwater as his guest (https://www.grant-williams.com/grant-williams-podcast/). Peter has recently released a book titled “The Confidence Map” (https://peteratwater.com/the-confidence-map-2/).
Peter lays out his Confidence Map as a four-quadrant grid across two factors: Control and Certainty. He then discusses the importance of “confidence”, and of training yourself to understand where you are on the map and to develop your “confidence” to best cope with the challenges/opportunities of the various quadrants, most particularly the lower-left quadrant. What he calls the “stress center”.
Figure 18: Peter Atwater’s Confidence Map

Source: Peteratwater.com
This aligns very closely with how we see the world. We would say that convexity equals confidence. Better brakes on your car makes you a more confident driver. A safety rope makes you a more confident rock climber. Effective asymmetric portfolio protection makes you a more confident investor.
This is the whole point of our “One Thing” concept as espoused in our June 2023 Update (https://convex-strategies.com/2023/07/13/risk-update-june-2023-one-thing/).
“Ask just about any fiduciary wealth manager/advisor what they are doing about risk managing and they will tell you some sort of version of driving slowly to reduce risk, eg. 60/40. Foregoing upside to mitigate downside. They will probably throw in some sort of predictive ability about when and where difficult curves in the track will appear, and how some combination of timing and slow driving will probabilistically keep YOUR car from crashing.”
Trying to reduce uncertainty through better predictive powers is a mug’s game. It will always be the unpredictable that has the most significant impact on your compounding path. Improve your ‘control’ through better convexity/confidence. With better brakes (higher control), using Peter’s terminology, your lowest periods of uncertainty move from the ‘stress center’ to the ‘launchpad’ (top-left quadrant). Likewise, in the times of highest certainty, better brakes (higher control) allow you to leap from the ‘passenger seat’ (lower-right quadrant), of a slow-driving fiduciary, into the upside convexity of the ‘comfort zone’ (top-right quadrant). Anybody that is accustomed to looking at our scattergram view will easily see how it overlays with Peter’s Confidence Map. Buying the convexity gives you control/confidence when it matters the most.
As an easy visualization, we can take an adapted “Always Good Weather” portfolio that uses as its brakes a 50% weighting in the CBOE Eurekahedge Long Volatility Index (EHFI451, an index of active volatility managers) and pairs it with equal 25% weights in SPX and NDX total return indices. This is our confident portfolio. On the traditional, low control, portfolio side we will use a 100% allocation to the Eurekahedge Top 50 Hedge Funds Index (EHFI400).
Figure 19: Always Good Weather 25% SPXT/25% XNDX/50% CBOE LongVol (blue) vs 100% Top 50 Hedge Funds (red). Scattergram View and Return Distribution, March’09 – Oct’23

Source: Bloomberg, Convex Strategies
While the traditional portfolio, ie. depending on predictions to quell uncertainty, is languishing in the depths of Peter’s ‘stress center’, the confident portfolio’s convexity kicks it sharply into the launchpad. All the while, this greater level of control and confidence allows far greater participation into the top-right ‘comfort zone’ quadrant.
Convexity = Confidence.
Compounding is driven not by average speed but by deceleration and acceleration.
Figure 20: Always Good Weather 25% SPXT/25% XNDX/50% CBOE LongVol (blue) vs 100% Top 50 Hedge Funds (red). Hypothetical returns, March’09 – Oct’23

Source: Bloomberg, Convex Strategies
The confident portfolio appears to be able to deliver superior compounded returns over the traditional portfolio. If we compare using our preferred risk measures, the confident portfolio may hypothetically have had a Downside Deviation risk of 3.4% and a Max Drawdown of 8.9% vs 5.0% and 11.3% for the traditional portfolio.
This is the value of investing in confidence. The value of investing in convexity.
A few final thoughts that keep coming up.
- You don’t hedge risks you don’t want to take; you hedge risks you do want to take.
- VIX and S&P vol are useful tools for constructing S&P hedges, not necessarily the best tools for constructing tail risk hedges for diversified portfolios.
- We consider correlation to be everyone’s key risk in their investment portfolio.
- A systemic shock will almost certainly trigger a sharp sell-off in major equity indices. A sell-off in major equity indices is, we think, not so likely to trigger a systemic shock. It is a matter of loss-absorbing capital and leverage.
- Evaluating a Long Vol/Tail Risk strategy based on its ability to mask or offset the cost, is working to the benefit of the manager, not the end capital owner. Don’t evaluate your goalkeeper on a goal-scoring metric. It isn’t meant to be an absolute return strategy.
We see bad habits across the industry, as relates to those above statements. It reminds us of this great quote from Thomas Sowell.
“When you want to help people, you tell them the truth. When you want to help yourself, you tell them what they want to hear.” Thomas Sowell.
Read our Disclaimer by clicking here