Why wait?
That’s the question we keep asking our central banking friends, most particularly the laggard of laggards, the ECB. Amazingly, it almost seems as if ECB President, Christine Lagarde, heard us and hid some nuggets of such newly discovered recognition inside an otherwise long-winded mea culpa on the need to pivot away from their monetary extremism.
https://www.ecb.europa.eu/press/blog/date/2022/html/ecb.blog220523~1f44a9e916.en.html
”…. it is appropriate for policy to return to more normal settings rather than those aimed at raising inflation from very low levels.” Christine Lagarde, 23 May 2022.
So, finally, they admit that their policies are currently at a setting aimed at raising inflation, and that it may not be the appropriate setting in the current environment. Of course, at no point is there any admission that said policies have actually been successful and somehow contributed to the current bout of price instability. Now, with their price stability measure spiralling out of control, they seem not simply reluctant to take a victory lap that their policies worked in raising prices, the objective for which they were put in place (allegedly), but downright keen to claim that it had nothing to do with their efforts. Ms. Lagarde even went so far as to note that leaving policy as it stands, with the inflation measure running away to the upside, amounts to a further easing of policy:
“With the inflation outlook having shifted notably upwards compared with the pre-pandemic period, it is appropriate for nominal variables to adjust – and that includes interest rates. This would not constitute a tightening of monetary policy; rather, leaving policy rates unchanged in this environment would constitute an easing of policy, which is not currently warranted.” Christine Lagarde, 23 May 2022.
The truth of her statement can be plainly seen, as their inaction over the last year or so has driven the real policy rate to absurdly negative levels.
Figure 1: ECB Real Policy Rate (ECB Deposit Rate – HICP yoy%)

Source: Bloomberg
With the boss providing high level cover, the entire ranks of the ECB have roared forth to signal their sudden pivot towards the need to combat the very inflation that they have, until unbelievably recently, sworn would dissipate all by itself, even as they powered on with their extreme inflation-ramping policy setting. Even Chief Economist Philip Lane, he of the perpetual undershoot of inflation projections, said in a recent interview that “it’s all about the prudent and robust and durable way of having normalization.”
As laid out in Ms. Lagarde’s blog note, the entire universe of ECB officials has now broadly voiced the consensus guidance that, during their upcoming June General Council meeting, they will announce that they will undertake their first hike of 25bp in the July General Council meeting, six weeks hence. So, per Ms. Lagarde’s comments about doing nothing is further easing, we should expect just that at the June meeting because, presumably, the Eurozone needs at least six more weeks of even greater negative real policy rates. Why wait?
Unusually, we find ourselves agreeing with Fed Chair, Jay Powell, on this topic.
“If you had perfect hindsight you’d go back, and it probably would have been better for us to have raised rates a little sooner,” Jay Powell, 12 May 2022.
Unfortunately, the ECB cohorts seem unwilling to learn from other’s mistakes. Just to give a quick visual of what the ECB’s projected July 25bp hike will look like, relative to their inflation measure, we can throw them together below.
Figure 2: Eurozone HICP yoy% (white) vs ECB Deposit Rate (blue). Projected July 25bp rate hike (red)

Source: Bloomberg
As we have noted before that probably isn’t going to do it, just as every other central bank has learned in the initial stages of their pivot to engaging in a fight that they had claimed ad nauseam wouldn’t be necessary.
As has been the case with each of the slow-to-eventually-come-around central banks, the market gets ahead of the implications of what it is going to take to explicitly fight inflation when your starting point is the most negative real rates in history. Staying with EUR, in figure 3 we have added the 1y1y forward swap rate to see how quickly the market is already moving ahead of the ECB.
Figure 3: Eurozone HICP yoy% (white). ECB Deposit Rate (blue). EUR 1y1y Fwd Swap Rate (orange). Projected July 25bp rate hike (red)

Source: Bloomberg
Everybody looks more or less the same on this metric, with the market pricing aggressively higher forward rates while the respective central banks eventually accelerate the pace of their policy rate hikes to try to catch up. The Fed behaved the same, quickly bringing forward their first hike from what had been the previous guidance, then hiked a meagre 25bp to get it started, only to accelerate to a 50bp hike, as the market pricing quickly exposed the nonsense of anything amounting to a “gradual” normalization. The Fed has since guided to an ongoing series of 50bp hikes. Surely 75bp hikes will be whispered before too long.
Figure 4: US CPI yoy% (white). Fed Funds Rate (blue). USD 1y1y Fwd Swap Rate (orange)

Source: Bloomberg
In the UK, the BOE started early with a thumping 15bp hike way back in December, only to find themselves struggling to keep up once the race was on. We will be sure to highlight when the future rounds of nonsensical letters are exchanged between the BOE Governor and the Chancellor of the Exchequer.
Figure 5: UK CPI yoy% (white). BOE Bank Rate (blue). GBP 1y1y Fwd Swap Rate (orange)

Source: Bloomberg
Even distant EM central banks such as the Bank of Korea are engaged in the nearly identical battle.
Figure 6: Korea CPI yoy% (white). Korea Policy Rate (blue). KRW 1y1y Fwd Swap Rate (orange)

Source: Bloomberg
After surprising most people with an earlier than expected initial 25bp hike in early May, the RBA jumped on the hamster wheel and scurried ahead with a 50bp hike in early June, again surprising the market. Nevertheless, market pricing has surged ahead building in expectations of even greater hikes down the road.
Figure 7: Australia CPI yoy% (white). RBA Policy Rate (blue). AUD 1y1y Fwd Swap Rate (orange)

Source: Bloomberg
In Governor Lowe’s official statement https://www.rba.gov.au/media-releases/2022/mr-22-14.html he, like Ms. Lagarde in her blog, stressed that he is merely removing the previously provided extraordinary accommodation.
“Today’s increase in interest rates by the Board is a further step in the withdrawal of the extraordinary monetary support that was put in place to help the Australian economy during the pandemic. The resilience of the economy and the higher inflation mean that this extraordinary support is no longer needed.” RBA Governor Philip Lowe, 7 June 2022.
Truly amazing that he apparently thought it was needed right up through this week.
RBNZ has consistently been the leader amongst developed market central banks. They started interest rate hikes back in October 2021, delivered a series of three 25bp hikes and have already followed with two 50bp hikes. They announced this week their plans for Quantitative Tightening (QT) https://www.reuters.com/article/brief-rbnz-details-planned-sales-of-new-idUSFWN2XV10A. Key points are:
- Reduce LSAP holdings to zero.
- Sell longest duration bonds first.
Once again, we have to wonder if they lead, and the rest eventually follow. We are notably biased but like to think that the RBNZ is hinting that QE was a bad idea from the start.
Figure 8: New Zealand CPI yoy% (white). RBNZ Policy Rate (blue). NZD 1y1y Fwd Rate (orange)

Source: Bloomberg
Back to the ECB and their dedication to commencing their fight to restore price stability after announcing a decision to make a further decision in July. Just to remind everyone, the ECB is an explicit “Inflation Targeting” central bank. On their website they state their mandate as thus:
“Our job is to maintain price stability. This is the best contribution monetary policy can make to economic growth and job creation. We keep prices stable by making sure that inflation – the rate at which the overall prices for goods and services change over time – remains low, stable and predictable. We are targeting an inflation rate of 2% over the medium term. Our commitment to this target is symmetric: we view inflation that is too low just as negatively as inflation that is too high”
“Our mandate is laid down in the Treaty on the Functioning of the European Union, Article 127 (1). The Treaty adds that “without prejudice to the objective of price stability”, the ECB shall also support the general economic policies in the EU with a view to contributing to the achievement of the Union’s objectives as laid down in Article 3 of the Treaty on European Union. These objectives include balanced economic growth, a highly competitive social market economy aiming at full employment and social progress, and a high level of protection and improvement of the quality of the environment – without prejudice to the objective of price stability.”
Low, stable and predictable would seem to have left the building. It is not a great leap to question if, possibly, some of their other objectives have indeed prejudiced against the price stability mandate. In the case of the ECB, they have coined the term “fragmentation” as their main “other” objective. Fragmentation is used to represent the risk of borrowing costs for the most heavily indebted Eurozone countries (ie. Italy) breaking higher as negative policy rates and ceaseless QE are withdrawn. We would proffer for the ECB, should they care to consider, that without price stability there can be no stability. This might be why wiser folks drafted into their mandate that all the other objectives must be “without prejudice to the objective of price stability”.
We can update our view on the ECB’s own noted prowess on projecting their measure of inflation now that we have the May HICP numbers.
Figure 9: Eurozone HICP yoy% change (blue) vs ECB quarterly forecasts through March 2022

Source: ECB, Bloomberg, Convex Strategies
We will get the new set of quarterly projections with the June meeting and will update next month. Through the May HICP numbers we can clearly see that Chief Economist Lane and the team continue with their solid track record of massively undershooting even the most immediate numbers. We append below the quote of confidence from President Lagarde after market pricing last October made a mockery of their updated projections from September (the grey line above). Of course, in her recent blog, they saw it coming all along and have reacted accordingly. Give us a break.
“We really looked and very deeply tested our analysis of the drivers of inflation, and we are confident that our anticipation and our analysis is actually correct.”
All the central banks have the same problem, and the ECB has it in spades. Can they adjust policy sufficiently to bite into raging higher prices? The ECB, just like the rest, will be shell shocked as market pricing tears higher secure in the knowledge that, if the ECB truly wants to fight inflation, they aren’t going to get it done with massively negative real rates.
One of the very few economists who we respect, the legendary Charles Goodhart, stated it very clearly at a conference this month.
“If inflation goes up and nominal interest rates do not anything like as much, that effectively is a decline in real interest rates……Virtually all the central banks including the ECB are an awful long way behind the curve.”
As tends to be the case, we heartily agree with Charles.
Now that the ECB is finally getting in the game, or at least telling us that they will be, come July, that leaves only the BOJ as literally the last man standing. We talked about it at some length last month https://convex-strategies.com/2022/05/19/risk-update-april-2022/. Recreating our same view of CPI, Policy Rate (in this case the 10yr JGB yield “peg”), and the 1y10y forward swap rate for Japan, we can see that it has yet to take on the shape of the above equivalents. Except, notably, for the CPI line which looks suspiciously similar to the rest.
Figure 10: Japan CPI (white). JGB 10yr Yield (blue). JPY 1y10y Fwd Swap Rate (orange)

Source: Bloomberg
The pressure on BOJ’s 10yr JGB peg is not going away.
Figure 11: Japan JGB 10yr yield and 0.25% BOJ intervention line

Source: Bloomberg
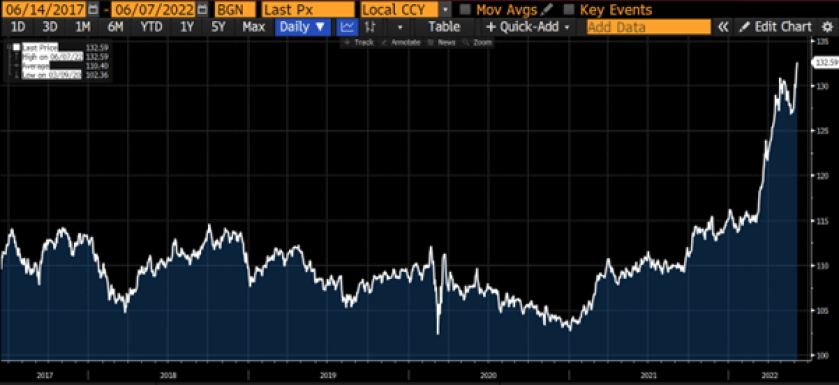
The implications for the JPY FX rate remain obvious.
Figure 12: USD/JPY FX spot rate
Source: Bloomberg
It is hard to imagine that BOJ’s challenges are going to get any better as the ECB joins the hiking brigade, the RBA revs up to 50bp hikes, and folks start talking aloud about the Fed ratcheting to 75bp increments. All pegs end badly. All pegs end.
As the pressure builds, it will be a matter of keeping track of how many of the few remaining available JGBs they soak up in their unlimited, every day, forever, Fixed Rate Operations and also worth keeping an eye on the direct implications of that buying on the USD/JPY FX rate. For those sufficiently mature, it will no doubt rekindle memories of the Bank of Thailand (BOT) in 1997. Back then, the BOT gave the strong impression that they were willing to let THB interest rates go anywhere the market wanted in exchange for maintaining the absolute inflexible pegged level of the currency. Today the BOJ is doing the same thing, just the other way around. They are intimating that they will allow the currency to go anywhere the market chooses to take it in exchange for maintaining the absolute inflexible pegged level of the 10yr JGB interest rate. Eventually, in the case of Thailand, in the trade-off between those suffering at the expense of explosively higher yields versus those benefiting from the misvalued pegged currency, the imbalance became too extreme. The BOT chose to allow the peg to break, the currency to devalue, and the sandpile to collapse.
In the modern-day example, the BOJ will have to balance the redistributive impact of those who suffer from a weaker JPY against those who benefit from a manipulated, pegged, uber-low interest rate. We can combine the above two charts, and line them up underneath the historical THB proxy, for what we think is a very alarming visualization.
Figure 13: USD/THB FX rate (blue, logged scale),THB 3mth FX Swap (white), June’96-June’99. Deval July 2nd 1997

Source: Bloomberg
Figure 14: JGB 10yr yield (blue), USDJPY FX rate (white, logged scale)

Source: Bloomberg
If anybody struggles to understand the trade-off that we are alluding to, we can put it more simply. If you think higher interest rates are the bigger risk because of the implications on asset markets, then you would fall on the side of central banks sustaining their extreme policy measures. If you think inflation is the bigger risk because of the implications on the cost of living, then you fall on the other side and think central banks should restore their price stability bona fides. Generally speaking, the “Greenspan Put Era” has revolved around appeasing the donor class and driving growth through the wealth effect of asset price inflation, wealth segregating implications be damned. Every now and again, the powers-that-be recognize some need to attend to the voter class when the cost/scarcity of food, shelter, energy, etc. start to trend towards folks with pitchforks gathering in ever larger numbers. Seems like we may be at one of those crossroads. Most of the world’s central banks have already recognized the dilemma and pivoted towards the broader problems facing the voter class and it is really only the ECB and BOJ that are still holding out.
From a portfolio perspective, the implications of the gathering end of the much-enjoyed Greenspan Put Era are that the presumptive risk mitigating portfolio benefits of the Fixed Income side of the 60/40 solution are being steadily shredded. We have shown over and over again that the Fixed Income component, the “40”, despite the friendly hand of central banks over the last decades, has been a poor portfolio contributor in either of the key metrics of participating or protecting. Only the inability of the fiduciary industry to measure opportunity cost has kept it from being fully discredited.
We use the chart in figure 15 as a regular example of the compounding superiority of a convex “Barbell” portfolio relative to a so-called sophisticated version of a Gaussian based “Balanced” portfolio, aka Risk Parity. In this example, going back to work we presented in our September 2021 Update https://convex-strategies.com/2021/10/19/risk-update-september-2021/, we have adjusted the respective weightings to equalize the downside volatility risk of the two strategies.
Figure 15: Theoretical convex ‘Barbell’ portfolio vs Risk Parity equalised to downside volatility

Source: Bloomberg, Convex Strategies
Readers may or may not be surprised to learn that probably the most common observation we get after presenting this chart, or any of the dozens like it that we can show, is “what about the cost?”. The “cost” that the questioner is referring to is the supposed single line cost of the Long Vol component of the blue compounding line. Just as we query at that point of the meeting, we ask again now, what cost exactly is it that you are worried about? Meanwhile, the same person will proudly expound on the modern-era miracle of the principles of Risk Parity, seemingly oblivious to the idea that the opportunity cost of the risk mitigating components of a Risk Parity portfolio are far higher relative to their benefits than what the nominal, explicit cost of Long Vol is relative to its benefit.
Negative carry should no more be considered a cost, than positive carry should be considered a profit. Negative carry is an investment in non-recourse leverage allowing the user to capture upside while foregoing downside; a pretty good formula if compounding returns is your investment objective. Positive carry is earning a nominal fee to watch as somebody else captures the topside, while you wear all the risk. Fiduciaries really ought to be managing to superior terminal outcomes of those compounding lines. Surely, the end capital owners, the pensioners, care a lot more about the 836.83 terminal capital number of the blue line than they do about whether all the individual line items in the red line had positive numbers every year (which they never do anyway) on their way to accumulating a dismal 275.08 of terminal capital. Investors and fiduciaries alike need to start caring about the opportunity cost of both inefficient and ineffective defensive strategies.
Read our Disclaimer by clicking here