“The economics discipline prefers to remain in fantasy land, ignoring real-world experience and far more realistic theories. It’s as if the Catholic Church not merely tried Galileo, but also destroyed all knowledge of his telescope. If they had, humanity might never have escaped the Dark Ages. Mainstream economists, it seems, are happier in the dark than in the light.”
Steve Keen article “The fantasy economics of the Nobel Prize”.
https://iai.tv/articles/the-fantasy-economics-of-the-nobel-prize-auid-2279?_auid=2020
This is a great little article from heretical economist Steve Keen. He is considered heretical by the consensus, neo-Keynesian, mob because he advocates that the expansion and contraction of credit is a relevant input in models of economic growth. This was a topic that used to come up regularly back in Professor Yellen’s Macro-Econ class and was always sent to the back of the classroom with prejudice! We wonder if Steve has ever heard of “Sharpe World”?
Taking the above point to the extreme, though we are not sure it is fair to class her as a member of the “economics discipline”, we give you the embedded clip of ECB President Christine Lagarde’s recent comments on an Irish talk show.
https://www.nasdaq.com/articles/no-christine-lagarde-inflation-did-not-come-from-nowhere
“Inflation has, um, just pretty much come about from nowhere.”
“We had been fighting deflation – so when prices were going down, down, down, down – trying to bring them to a steady level so that people knew about stability.”
Figure 1: Eurozone HICP Index (white) and M2 Money Supply Index (blue). ECB Total Assets (papaya)

Source: Bloomberg
Two pretty obvious objections can be asked of Ms. Lagarde:
- Where exactly in the path of the white line, the compounding price index, was the part where prices were going “down, down, down, down”?
- Were you so confident that your efforts towards “fighting deflation” WOULD NOT WORK, ie buying up assets and jacking up money supply at unprecedented rates along with pushing policy rates to negative territory (not shown), that you can now claim that the spike higher in your price stability measure “came about from nowhere”?
For the last year or so we have ridiculed the forecasting prowess of the ECB’s team of economists, led by Chief Economist Philip Lane. The updated version of our tracker of their HICP measure versus their forecasts through the September 2022 projections and the November 2022 realized HICP numbers is shown below.
Figure 2: Eurozone HICP yoy% (blue) vs ECB quarterly forecasts through September 2022
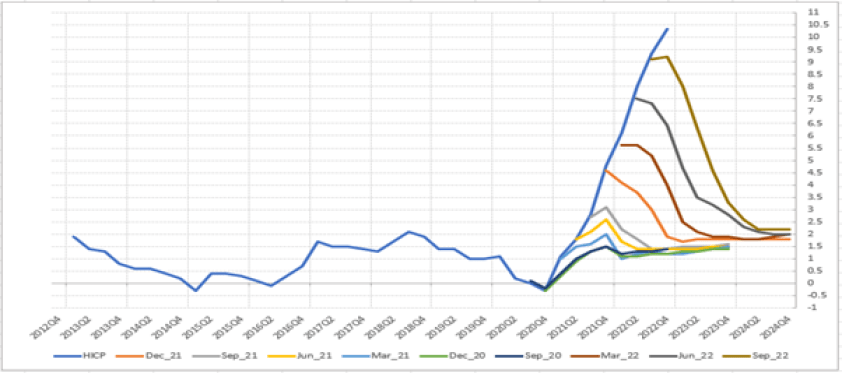
Source: Convex Strategies
Last month we pondered as to what levels of econometric complexity had gone into generating these projections and, for simplification purposes, dubbed the ECB model as “Draw a Straight-line Down Model” or DSDM.
Well, they must have heard us, and our dreams have been answered! Mr. Lane himself penned a nearly 50-page blog that went up on the ECB’s website. The blog goes to excruciating length to explain (away?) how they consider “inflation”.
https://www.ecb.europa.eu/press/blog/date/2022/html/ecb.blog221125~d34babdf3e.en.html
Back in our October 2021 Update (https://convex-strategies.com/2021/11/19/risk-update-october-2021/) we phrased it this way:
“It begs the question, are they terribly poor forecasters, or should we simply assume it is all a blind attempt at manipulation? It makes us wonder what is worse – that the market thinks that their forecasts are just wrong, or that the market thinks their forecasts are intentionally misleading?”
We are reminded yet again of Nassim Taleb’s quote, “Anyone who causes harm by forecasting should be treated as either a fool or a liar.”
In our December 2021 Update (https://convex-strategies.com/2022/01/17/risk-update-december-2021/) we threw out this request:
If anybody bumps into the likes of Christine Lagarde or Philip Lane, could you do us a favour and throw out these questions?
- If you had correctly forecast HICP rises over the last 15 months, would you have adjusted policy?
- For how long, and at what scale, would your forecasts need to continue to fail for you to change your methodology and/or recommend policy action?
- What level of negative real rates do you think will lead HICP increases to moderate back to your forecasts/target?
- Most fundamentally, what is the intended impact on your price stability measure from your current extreme monetary policy setting?
We are sad to report that Mr. Lane, despite the 49-pages of explanation, failed to really address any of these issues.
Mr. Lane kicks right off by triggering one of our pet peeves, namely to apply the modern-day trick of re-defining inflation as a change in price level. He leads straight off with; “The simplest form of inflation is an increase in the overall price level that consists of a uniform increase in the prices of all items, with relative prices unaffected.” As readers will have heard from us many times before, we prefer the classical definition of inflation, ie an increase in money and credit. Ludwig von Mises states it very clearly:
“There is nowadays a very reprehensible, even dangerous, semantic confusion that makes it extremely difficult for the non-expert to grasp the true state of affairs. Inflation, as this term was always used everywhere and especially in this country, means increasing the quantity of money and bank notes in circulation and the quantity of bank deposits subject to check. But people today use the term “inflation” to refer to the phenomenon that is an inevitable consequence of inflation, that is the tendency of all prices and wage rates to rise. The result of this deplorable confusion is that there is no term left to signify the cause of this rise in prices and wages.” Economic Freedom and Interventionism, 1990.
Mr. Lane very clearly plays this game. There is plenty to criticize about his blog, but most significantly is the total lack of any representation of a causal effect of ECB policies on rising prices which is of course precisely the point made in the final sentence in the above quote.
Only once in the entire body of the text does Mr. Lane even note, and that is as a parenthetical aside to the fact that it is now supposedly restrictive, the ECB’s monetary policy as having had an accommodative role.
“At the same time, the considerable easing in supply bottlenecks, the post-pandemic normalisation of the economy, the adverse real income impact of the deterioration in the terms of trade and the demand-reducing impact of the normalisation of monetary policy (compared to the accommodative monetary policy that was in place until the end of 2021) will all put downward pressure on near-term and medium-term inflation.”
We completely disagree about how long they maintained accommodative policies, and happily argue if their current policies would even qualify as “normalised”. Their balance sheet expansion and -0.50% Deposit Rate extended all the way through the first half of 2022. Nevertheless, throughout the entirety of the period when the ECB was running “accommodative monetary policy”, the DSDM model was still producing the exact same output.
Figure 3: Eurozone HICP yoy% (white). ECB Deposit Rate (blue). Through June 30, 2022

Source: Bloomberg
Figure 4: Eurozone HICP Index (white). ECB Assets (blue). Through June 30, 2022

Source: Bloomberg
There is no discernible effort throughout the blog to explain why Mr. Lane’s DSDM forecasts have consistently been wrong in the complete opposite direction of realized HICP numbers. For perspective, as you can see in Figure 2, current Q4 2022 numbers are running a full 9.0% above the projections generated by Mr. Lane’s DSDM efforts back in September 2021. This relentlessly repeated digression gets no attention in his blog, much less any discussion that the sustained policy settings may have had some impact on the subsequent outcomes. How much further has HICP been allowed to exceed their solely mandated target because of bad policy decisions made off the justification of horribly poor forecasting?
Mr. Lane, just like Ms. Lagarde above, is persistent in his propagandist representation of the ongoing price instability as having “come about from nowhere”. He regularly refers to the “surprise inflation”, or as it being “atypical”. Of course, raising the question, do we really need PHD forecasters for typical price changes? For expected inflation?
In general, everything in the note is trying to justify why we should assign some analytical logic to the output of their DSDM model. Everything biases towards some explanation why the price increases might not be sustainable and, thus, may not justify more restrictive policy action. The asymmetrical policy bias rings through loud and clear. Where was all this cautious equivocation when they were deliberating the move to a negative Deposit Rate and the purchase of trillions of assets onto their balance sheet?
We could go on and on, but to our eyes virtually every paragraph of this piece includes some attempt to manipulate perspective and justify the failed output of their DSDM. If you want to learn something about economics, you won’t find it here. If you are curious about Orwellian Econ-Double-Speak, this is pure gold. It is modern central banking at its finest; we should trust that they have all the genius to guide the economy to desired future outcomes, while assuring us that the current state of affairs has nothing whatsoever to do with their past policy efforts.
By way of example we give you the following snippet. We aren’t the least bit sure what it all means but, at a guess, we would surmise they are sticking with the DSDM until it gets it right:
“…a proper assessment of the likely future path of inflation is best conducted in the context of a comprehensive macroeconomic projections exercise (jointly assessed with a full review of monetary and financial conditions), in view of the inter-connections between economic activity levels, financial conditions (including the interest rate path) and inflation dynamics. Accordingly, while partial-equilibrium approaches (including the inspection of underlying inflation measures and the analytical decomposition of the latest inflation readings) certainly play a useful role in updating inflation priors on a week-by-week basis, the richest inflation assessment is produced through the integrated joint analysis of nominal indicators, economic activity measures and monetary and financial conditions.”
By very welcome contrast, a far more worthwhile set of comments, as well as some great slides were provided by ECB Executive Board Member, Isabel Schnabel, at a couple of different speeches that she delivered late in November.
Isabel Schnabel speech at the Bank of England Watchers’ Conference.
https://www.ecb.europa.eu/press/key/date/2022/html/ecb.sp221124~fa733bc432.en.html
Isabel Schnabel slides from IG Metall speech.
Ms. Schnabel, unlike Mr. Lane, does assign some responsibility for the current price stability challenges to the combined efforts of monetary and fiscal policy through the pandemic crisis and suggests both should play significant roles in restoring said stability.
She goes where Mr. Lane dares not venture and mentions the obvious – “real rates remain in negative territory for most tenors, meaning policy is likely too accommodative”.
Figure 5: Eurozone Real GDP-weighted Yield Curve

Source: Isabel Schnabel IG Metall Slides.
Her point rings true to our comments made back in our January 2022 Update https://convex-strategies.com/2022/02/18/risk-update-january-2022/
“Policymakers desperately want to believe that they can impose some constraint on their price stability measures through an adjustment in nominal yields, while simultaneously maintaining the credit creation necessary to keep the economy and asset prices from collapsing by having sufficiently negative real rates.”
Also, our often-quoted words from Arthur Burns:
“In principle, no matter how high the nominal interest rate may be, as long as it stays below or only slightly above the inflation rate, it very likely will have perverse effects on the economy; that is, it will run up costs of doing business but do little or nothing to restrain over-all spending……In many countries, however, these rates have at times in recent years been so clearly below the ongoing inflation rate that one can hardly escape the impression that, however high or outrageous the nominal rates may appear to observers accustomed to judging them by a historical yardstick, they have utterly failed to accomplish the restraint that central bankers sought to achieve.” Arthur Burns, 1979.
Ms. Schnabel also joins us in taking a swipe at Mr. Lane’s forecasting record.
Figure 6: “Projections are pointing to a sharp decline in inflation, but history of projection errors.”

Source: Isabel Schnabel IG Metall Slides.
We think our chart is better, but we applaud her for the effort!
Our impression, in going through this truly excellent selection of slides, is that Ms. Schnabel is making the point that circumstances, as presented by her economic colleagues, don’t exactly add up. Labour is historically tight. Wages are at negative real extremes and look very likely to rise. Price increases are broad. Real borrowing costs are very low, even negative. Inflation expectations are peeling towards the right-hand tail. How do these things all add up to the output of Mr. Lane’s DSDM?
As usual, the individual that everyone should be listening to is our good friend William White. The below link is a 10-minute opening comment from Bill for the 25th Central Bank Macroeconomic Modelling Workshop. Readers, if you only have time to click down into one link in this note, make sure this is the link. He says it so simply, and so politely. If you know any practicing central bankers, please, for the good of the world, forward them the link.
For the second year running, it looks like Bill, who we have dubbed the Poet Laureate of Economics, will be walking away with our quote of the year.
“I thought it was a good idea to target the exchange rate. I thought it was a good idea to target the NAIRU. I thought it was a good idea to target the money supply. All of those things, I now realize, I was wrong. I was wrong because the underlying belief was that the economy was deterministic, that it was understandable, that it was fully controllable. That’s just not so.”
It is not possible to completely understand the complex adaptive system that is the economy, much less possess the tools to control and manoeuvre it. Nobody can define the economy as it currently stands, much less forecast where it is going. Even less so, understand how interactions with it will impact first, second, third order outcomes. Proper safeguarding of global financial systems require risk management and not fake forecasts; to protect against outcomes, like the current bout of price instability, instead of driving them. Listen to Bill White!
Bill really is the modern-day Hayek. Once again, we refer you to Hayek’s Nobel Prize Lecture, “The Pretence of Knowledge”.
https://www.nobelprize.org/prizes/economic-sciences/1974/hayek/lecture/
“If man is not to do more harm than good in his efforts to improve the social order, he will have to learn that in this, as in all other fields where essential complexity of an organized kind prevails, he cannot acquire the full knowledge which would make mastery of the events possible. He will therefore have to use what knowledge he can achieve, not to shape the results as the craftsman shapes his handiwork, but rather to cultivate a growth by providing the appropriate environment, in the manner in which the gardener does this for his plants. There is danger in the exuberant feeling of ever growing power which the advance of the physical sciences has engendered and which tempts man to try, “dizzy with success”, to use a characteristic phrase of early communism, to subject not only our natural but also our human environment to the control of a human will. The recognition of the insuperable limits to his knowledge ought indeed to teach the student of society a lesson of humility which should guard him against becoming an accomplice in men’s fatal striving to control society – a striving which makes him not only a tyrant over his fellows, but which may well make him the destroyer of a civilization which no brain has designed but which has grown from the free efforts of millions of individuals.”
We feel the same way about investment portfolios. Solve for what you don’t know! Managing risk is about pay-out function, not about forecasting. In constructing portfolios that target superior geometric compounding (which should be everybody’s objective), solve for the denominator! Once you truly mitigate risk, ala our race car analogy, you can drive faster. Convexity is the key. Add convexity to both tails of the return distribution and watch the compounding tick upward.
We linked above our October 2021 Update. In the latter portion of that Update, we embedded a picture of a range of “diversified” portfolios, standardizing them for downside deviation risk of a 0.6x S&P beta portfolio. The point of the Performance Grid was to show how so many of what are considered portfolio diversifiers do not make a positive risk adjusted contribution to a portfolio.
We have updated those numbers, using the same portfolio weightings from the October 2021 Grid. As a quick reminder, AGW = Always Good Weather Portfolio achieved by 40% SPX/40% Nasdaq/40% CBOE Eurekahedge Long Vol Index and Dream Portfolio = 60% SPX/20% Gold/40% CBOE Eurekahedge Long Vol Index.
Figure 7: Performance Grid Jan2005-Nov2022. Oct2021 Weights

Source: Bloomberg, Convex Strategies
Figure 8: Terminal Capital and CAGR. Oct2021 Weights

Source: Bloomberg, Convex Strategies
Given market environments over recent times, we see that the respective downside vol risks have diverged from our previous grid. If we play the same game of adding SPXT to a portfolio that needs an uplift in risk and adding cash to those that need to reduce risk, we can reconstruct the grid to roughly equalize the downside vol. once again.
Figure 9: Performance Grid Jan2005-Nov2022. Standardized to Downside Vol

Source: Bloomberg, Convex Strategies
Figure 10: Terminal Capital and CAGR of Risk Equalized Investment Portfolios

Source: Bloomberg, Convex Strategies
The portfolio benefit of the long vol component, as well as gold, has increased significantly over recent times. Back to our race car analogy, the potential braking capacity was even greater than had been utilized in some, previously captured with ex-post measures, past tricky parts of the circuit. This is something we speak about all the time. Ex-post measures of returns do not necessarily tell you what additional available protection (braking capacity) may have been in place. It doesn’t tell you what risks were hidden beyond what was merely revealed in a given event. This gets to the magic elixir of garnering sufficient convexity to turn negative skew events into positive ones. Truly, more risk is less risk.
Comparing the risk adjusted AGW to the downside vol equalized Balanced Portfolio starts to look ridiculous.
Figure 11: AGW + 20% SPXT vs Balanced 57%/43%. Jan2005-Nov2022. Scattergram and Return Distribution

Source: Bloomberg, Convex Strategies
Figure 12: AGW + 20% SPXT vs Balanced 57%/43%. Jan2005-Nov2022. Compounding view

Source: Bloomberg, Convex Strategies
Just a very straightforward example of composing strategies with similar downside deviation risk and constructing something with far superior returns.
It is easy enough to do it the other way round, equalizing by returns and building a portfolio with superior risk dynamics. Also, just to show that it is really the math of compounding and not simply the inefficiency of fixed income (or others) as a diversifier, we will use 100% S&P for this comparison. The CAGR of 100% S&P over this period is 9.3%. Our unadjusted Dream Portfolio for the same period has a CAGR of 9.9%. Somewhat similar, but look at the difference in the risk factors!

No end capital owner, in their right minds, should be happy to take on the risk of 100% all-in, when for a fraction of that amount of risk they can get the same or better long term compounded returns. Don’t let lazy fiduciaries spin you into “riding out the swings” over a long enough investment horizon. Those “swings”, left exposed, are compounding destroyers but, with convexity, can be the best of compounding enhancers.
Figure 13: Dream Portfolio vs S&P 100%. Jan2005-Nov2022. Scattergram and Return Distribution

Source: Bloomberg, Convex Strategies
Figure 14: Dream Portfolio vs S&P 100%. Jan2005-Nov2022. Compounding view

Source: Bloomberg, Convex Strategies
Now, if you say “hey, I’m happy to take on more risk than is being incurred in the Dream Portfolio”, then start adding more upside participation. As we show above, even adding an additional 60% weight to the SPX portion of Dream, still only gets you to the Downside Vol risk of a 0.6x S&P beta. With the portfolio benefits of the Long Vol and the Gold, you are free to experiment with stuff that has greater upside participation. Hypothetically, one could switch the whole beta component into something more juiced, like Nasdaq. You could play with a little bit of leverage. What would it look like if we adjusted to 80% Nasdaq against the 20% Gold and 40% Long Vol?

Still significantly less risk but now with a lot more return. Participate and protect.
Figure 15: Dream Portfolio w/ 80% Nasdaq vs S&P 100%. Jan2005-Nov2022. Scattergram and Return Dist

Source: Bloomberg, Convex Strategies
Figure 16: Dream Portfolio w/ 80% Nasdaq vs S&P 100%. Jan2005-Nov2022. Compounding view

Source: Bloomberg, Convex Strategies
We have said it before. When you are convex, more risk is less risk. You can keep tinkering with the above theoretical risk / return dynamics over and over. Efficient, negatively correlating, asymmetric protection reduces risk and adds return. Concerns over “negative carry” are vastly mis-stated. That “negative carry” is not a cost, it is an investment in non-recourse leverage. A moderate fee allowing unfettered participation on the upside, while forgoing unforeseen downside. It is, literally, an investment in the key ingredient for improved compounding. If you want to improve your compounding, focus on the denominator (risk). If you are dealing with a fiduciary that is solely focused on the numerator (returns), that is foregoing upside to reduce downside, that is arguing away past and potential negative compounding events with a “just ride them out” mindset, you might find that your capital is captured inside “Sharpe World”.
Read our Disclaimer by clicking here