Not so long ago, there was a Federal Reserve Chairman by the name of Paul Volcker, who was preceded by William Miller and, before him, Arthur Burns. We will leave it to readers should they like to dig up and read the history of these gentlemen but suffice to say they were the chaps that had to deal with the initial aftermath of Nixon’s de-pegging of the USD from gold, which ushered in the post-Bretton Woods era of a pure fiat-based currency system. Burns and Miller presided over the greatest spike in CPI, thus far, in modern US history. CPI rose from as low as 2.7% in 1972 to a peak of circa 14.75% in early 1980. Miller famously argued that many of the attributes of inflation during his short tenure in 1978-1979 were transitory and should not be dealt with using monetary policy tools. Sound familiar?
Chair Volcker’s reputation lives on as the last true central bank vanquisher of inflation. With great commitment he declared that inflation must be reigned in, regardless of the consequences to growth and employment. He accomplished this by raising the Federal Funds rate as high as 20%, definitively slaying the beast by mid-1982, and setting the stage for nearly four decades of falling interest rates. He was followed as Fed Chair in succession by Alan Greenspan, Ben Bernanke, Janet Yellen and Jay Powell who have incrementally marched interest rates down to 0% and added such innovative, if not fully understood, forms of monetary loosening as Quantitative Easing (QE), Forward Guidance, Large Scale Asset Purchase Programs (LSAP), Interest on Excess Reserves (IOER), and a whole further alphabet soup of various money printing, moral hazard inducing acronyms; ESF, PMCCF, SMCCF, TALF, MMLF, CPFF etc.
Figure 1 below shows Fed Funds rate from 1971 through to today. The vertical lines break it up by the terms of the respective Fed Chairs. We have drawn in two horizontal lines to mark the average Fed Funds rates during what we have defined as the period of “Hikers”, 1971-June1982, and the period of “Cutters”, June1982-March2021. The Hikers average comes out at 8.79%, whilst the Cutters average a lowly 3.91%, with Last 20yr average of 1.5%.
Figure 1: Fed Funds Rate by Fed Chair

Source: Bloomberg
Federal Reserve Chairmen:
- Arthur Burns. Feb1970-Jan1978
- William Miller. Mar1978-Aug1979
- Paul Volcker. Aug1979-Aug1987
- Alan Greenspan. Aug1987-Jan2006
- Ben Bernanke. Feb2006-Jan2014
- Janet Yellen. Feb2014-Feb2018
- Jerome Powell. Feb2018-present
We discussed at length the transformation of the Fed’s self-interpretation of their mandate in our August 2020 Update, https://convex-strategies.com/2020/09/21/risk-update-august-2020/, which heralded the arrival of “Average Inflation Targeting and Maximum Employment”. As markets in March continued to react to the expectations of post Covid Pandemic reflation, we were treated to Chair Powell’s reiteration of this commitment and of his seemingly definitive belief that the Phillips Curve is dead. In his March 17th FOMC press conference, Chair Powell threw out such statements as:
“Our ability to achieve maximum employment in the years ahead depends importantly on having a longer term inflation expectations well-anchored at 2%. As the committee reiterated in today’s policy statement, with inflation running persistently below 2%, we will aim to achieve inflation moderately above 2% for some time so that inflation averages 2% over time and longer-term inflation expectations remain well-anchored at 2%. We expect to maintain an accommodative stance of monetary policy until these employment and inflation outcomes are achieved.”
“There was a time when inflation went up, it would stay up. And that time is not now. That hasn’t been the case for some decades. We won’t suddenly change to another regime. These things tend to change over time, and they tend to change when the central bank doesn’t understand that having inflation expectations anchored at 2% is the key to it all. Having them anchored at 2% is what gives us the ability to push hard when the economy is really weak. If we saw inflation expectations moving materially above 2%, of course we would conduct policy in a way that would make sure that that didn’t happen. We’re committed to having inflation expectations anchored at 2%, not materially above or below 2%.”
It has become increasingly common in the market to refer to Chair Powell as the “reverse-Volcker”, in some form or another. Just as former-Chair Volcker claimed he would tackle inflation, heedless of the side-effects to growth and employment, so today Chair Powell has declared he shall pursue Maximum Employment, heedless of the implications to price stability. We find it good fun to imagine a panel discussion/debate between the two of them on the topic, but sadly the best we can do is line up some quotes on the topic to match against each other. A few Volcker classics to compare to the above comments from Powell:
“A remarkable consensus has developed among modern central bankers … that there’s a new ‘red line’ for policy: a 2 percent rate of increase in some carefully designed consumer price index is acceptable, even desirable, and at the same time provides a limit. I puzzle at the rationale. A 2 percent target, or limit, was not in my textbooks years ago. I know of no theoretical justification.”
“Inflation is thought of as a cruel, and maybe the cruelest, tax because it hits in a many-sectored way, in an unplanned way, and it hits the people on a fixed income hardest. And there’s quite a lot of evidence, contrary to some earlier thinking, that it hits poorer people more than richer people, who have more maneuverability, more ways to protect themselves – who own their houses, for instance.”
“It is a sobering fact that the prominence of central banks in this century has coincided with a general tendency towards more inflation, not less. [I]f the overriding objective is price stability, we did better with the nineteenth-century gold standard and passive central banks, with currency boards, or even with ‘free banking.’ The truly unique power of a central bank, after all, is the power to create money, and ultimately the power to create is the power to destroy.”
From a practical perspective, the conquering of inflation by Volcker, through aggressive tightening of interest rates followed by decades of declining rates, ushered in a Utopian period for portfolio management. The ubiquitous Balanced Portfolio could hardly have found a more apt environment for its broad usage. Below we show the logged returns of a 60/40 (60% S&P Total Return and 40% Bloomberg Barclays US Treasury Total Return Index) balanced portfolio broken down by the terms of the respective Fed Chairs. You will note that we have broken the term of Chair Volcker into two portions, the first for the initial period where he was generally hiking rates, and the second for the latter part when he was generally cutting rates.
Figure 2: 60/40 Balanced Portfolio (logged) Performance by Fed Chair

Source: Convex Strategies, Bloomberg
Utopia indeed.
Unsurprisingly, the period defined as “Hikers” paints a somewhat gloomier picture.
Figure 3: 60/40 Balanced Portfolio (logged) Performance: Hikers Era

Source: Convex Strategies, Bloomberg
The truly sweet era was after Volcker’s battle with inflation had been won and interest rates commenced their historic multi-decade decline. It does, for the cynical among us, beg the question as to how so many pension funds are unrecoverably underfunded.
Figure 4: 60/40 Balanced Portfolio (logged) Performance: Cutters Era

Source: Convex Strategies, Bloomberg
It is not much of a stretch to argue that a key to this magical era has been the perpetual compression of real interest rates. Below we show a simple proxy of this in the form of US 10yr Treasury Yields minus CPI Y-o-Y change. This proxy has steadily declined from circa 8% in the post-Hiker Volcker era to now at or below 0%.
Figure 5: Real Rate Proxy. US 10yr Tsy Yield minus CPI Y-o-Y Change

Source: Convex Strategies, Bloomberg
One could certainly make the case that Volcker’s defeat of inflation justified a great deal of this decline in real yields from their early 1980s peaks, aided to some extent by an ever-lower Fed Funds rate. However, post the Great Financial Crisis, with the advent of QE and the myriad other accommodative central bank innovations, one could contend that the heavy hand of central bank intervention has become increasingly necessary to impose and sustain these historically low levels of real rates. This would be what is commonly referred to as “financial repression”. If, however, Volcker’s quelling of inflation ushered in the golden era of balanced portfolio management, what might Powell’s “reverse-Volcker” mean for said strategy?
Many will not believe that Chair Powell, in an environment of unprecedented global outstanding debt, can successfully pull off his trick of yanking inflation out of his hat. Yet, as we discussed again last month https://convex-strategies.com/2021/03/17/risk-update-february-2021/ signs of inflation (transient or otherwise) are proliferating. Certainly, the below two visuals have to raise some concerns that possibly those operating the controls “behind the curtain” might be fiddling with buttons and levers unaware of all their functions. Both monetary and fiscal experiments have drifted beyond previous ranges of experimentation. It is hard to imagine that there will not be some second order effects courtesy of the actions of these mad wizards.
Figure 6: US M2 Money Supply Y-o-Y% (gold) and Fed Funds Rate (white)

Source: Bloomberg
After a decade of front-end rates being pegged to zero (or lower) and unprecedented asset purchases by central banks the world over, 10yr US Treasury rates are roughly flat to where they were in late 2011. Even if Chair Powell and his followers persist, can they make holding fixed income securities a long-term favourable investment? Can they convince market participants to hold onto low / non-returning investments even as they debase currency relentlessly through money and credit growth? Post Chair Powell’s “reverse-Volcker” commitments and his former-Chair Williams-like “transient” proclamations, will investors want instruments with very limited upside and potentially devastating downside? We suspect not.
After the post-Pandemic success of ever greater financial repression, we saw interest rate volatility decline to historical extremes, diverging from historic norms relative to equity volatility. That dichotomy, at least for the time being, is showing signs of correcting. As we regularly comment, it is uncanny how often the thing that hits historically extreme low volatilities is the next thing to dislocate. Of course, the low price of volatility is simply a proxy for the building of implicit leverage in the system. It is itself indicative of nascent fragility.
Figure 7: VIX Index (white) vs MOVE Index (blue) (normalized)

Source: Bloomberg
So, what is a portfolio manager to do after forty years of grazing in the ripe pastures of the post-Hiker Volcker world? What is to be done with the massive chunks of dead capital tied up in the fixed income side of the 60/40 Balanced Portfolio? You all know our thoughts. Convexity! Do the thing that would have outperformed 60/40 even during the four-decade decline of interest rates. Add convexity to your portfolio. Own efficient explicit protection, eg. Long Vol, and take more upside risk. Get away from things with bounded upside and correlated downside!
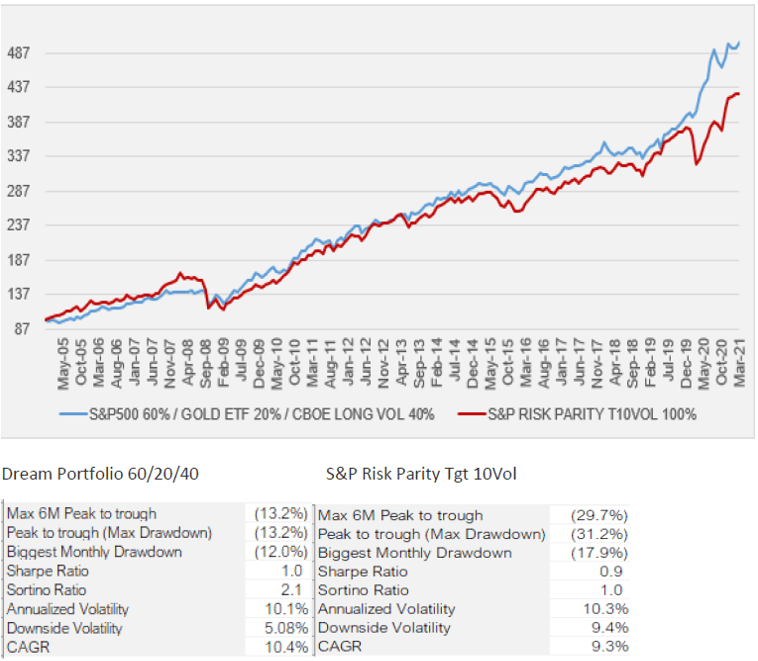
We have shown it over and over again, no strategy has benefited more from the Utopian world of falling interest rates and central bank reaction function than Risk Parity. Yet, even that supposedly world beating genius can be shown to be outdone by a positively convex portfolio solution. We like to show our theoretical “Dream Portfolio” (60% S&P, 20% Gold, 40% Long Vol) against the S&P Risk Parity Target 10% Vol Index since both have roughly the same portfolio volatility.
Figure 8: “Dream Portfolio” vs Risk Parity
Source: Convex Strategies, Bloomberg
The superior convexity Dream Portfolio displays better compounded returns, and much higher quality risk dynamics, ie. nearly half the downside volatility and less than half the Max Drawdown. The differing convexity makes itself apparent when we get realizations in the wings, eg. 2020. And remember, we are talking about a period where yields came down about as much as they possibly could have, benefiting the levered fixed income positioning behind the entire Risk Parity logic. It is hard to imagine that will be the case over the next decade or so.
If we dial up the leverage of the Dream Portfolio, make it 100% S&P/40% Gold/40% Long Vol, to match the Max Drawdown of the Risk Parity Portfolio we get something that looks like this.
Figure 9: Dream Portfolio (risk adjusted) vs Risk Parity

Source: Convex Strategies, Bloomberg
As is ever the case, the benefits of the more convex investment portfolio show their colours during the periods of realizations in the wings, thus making 2020 a year where separation really takes place. We can see this clearly in our scattergram format.
Figure 10: Dream Portfolio vs Risk Parity Scattergram View

Source: Convex Strategies, Bloomberg
The positively convex blue parabola of the Dream Portfolio is what we believe all portfolio managers should be shooting for in some form or another, not the concave red parabola, which looks a lot like a short put option and a far too common dynamic of things like the Risk Parity portfolio.
Or an Endowment Portfolio.
Figure 11: Dream Portfolio vs Endowment Index

Source: Convex Strategies, Bloomberg
Or a Hedge Fund.
Figure 12: Dream Portfolio vs HFR Global Hedge Fund Index

Source: Convex Strategies, Bloomberg
Or a group of Top 50 Hedge Funds.
Figure 13: Dream Portfolio vs Eurekahedge Top 50 Hedge Fund Index

Source: Convex Strategies, Bloomberg
Or a Fund of Hedge Fund Portfolio.
Figure 14: Dream Portfolio vs HFR Fund of Fund Index

Source: Convex Strategies, Bloomberg
Or a High Yield Bond Portfolio.
Figure 15: Dream Portfolio vs US Corporate High Yield

Source: Convex Strategies, Bloomberg
Or a Covered Call Buy Write Portfolio.
Figure 16: Dream Portfolio vs CBOE Buy Write Index

Source: Convex Strategies, Bloomberg
Or an explicit Put Write Portfolio.
Figure 17: Dream Portfolio vs CBOE Put Write Index

Source: Convex Strategies, Bloomberg
We could go on and on and on. Finding portfolio strategies with poor convexity constructs is certainly not a challenge, in fact nearer to universal in the world of short term, arithmetic return, incentive structures. Nevertheless, even we are impressed at how much the above series of scattergrams look alike. Funny how, when everyone is chasing the same objective, they all end up with highly correlated and nearly identical risk/return dynamics of bounded upside and correlated downside. It truly is the bane of compounded returns and demonstrably a disservice to the end capital owners.
En passant, we can add Archegos, along with Greensill and Melvin Capital, to the list of signs that there might be fragility in the system. It is yet another great example of what we refer to as “uncapitalized tails”. Yet again, the flawed risk requirements, paired with the moral hazard and generous leverage cost at the heart of the financial system, has led to banks incurring significant losses. How many more of these are there out there?
It seems only fair to leave the last word to Paul Volcker and a quote as relates to the moral hazard implications of central bank’s insatiable determination to come up with ever more programs to save the system.
“What’s critical, of course, is that any change protect the core principle: ‘Thou shalt not gamble with the public’s money.”
We fear that horse has already bolted.
Figure 18: Volatility “Comet” S&P 500 3M Realised Correlation vs Implied Volatility

Source: Convex Strategies, JP Morgan
Read our Disclaimer by clicking here