Concerns about the economic and financial implications for the spreading Corona Virus pandemic finally cracked the markets seemingly unshakeable complacency. In the last several days of the month, stock markets globally turned off their recent highs (historical highs in many cases) and fell sharply, right into the last day of February. This resulted in sharp and fast rises in the two risk factors that matter the most to any diversified portfolio, volatility and correlation. Our Volatility / Correlation “Comet” in Figure 1 shows the jump in those two factors (big white dot) on February 28th, 2020. We also highlight (slightly smaller white dots) the two most recent jumps in vol and correlation from February 5th, 2018 (the XIV stop out) and December 24th, 2018. It is clear to see in the pretty picture that this shock is right on the threshold of where past end-of-cycle unwinds have been triggered. Is this that time things keep going and we get the unwinding of the unprecedented build-up of risk in the system, or is this just another buy-the-dip opportunity like in early and late 2018?

Source: JP Morgan, Convex Strategies
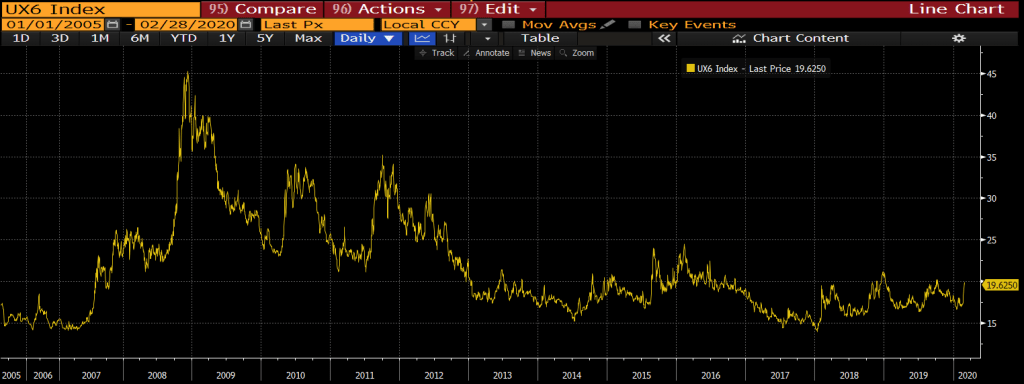
Of course, we will only know in hindsight, but we do have a few obvious points that can be made. Most particularly, while it looks impressive on the old Comet picture, what has happened thus far through February is really nothing much in terms of leverage/short vol unwinding. Here are some simple pictures to give some perspective. In each case we show a chosen volatility price with a start date of 2015 through to the end of February 2020 and then another one with a start date of 2005 through to the end of February 2020. It gives a great perspective! On the shorter period, after the compressing vols over that five year period, it looks like what just happened in the mere last week of February was quite a decent unwind. However, when we look at the fifteen year period, it gives a very different perspective. That perspective, and the gist of this note, is: If this is the end-of-cycle unwind, there is a whole bunch more to go!

Source: Bloomberg
Source: Bloomberg

Source: Bloomberg

Source: Bloomberg

Source: Bloomberg

Source: Bloomberg
Despite the seemingly sharp delta move lower in a number of equity markets, thus far there has been barely any risk unwind. If this is indeed “IT!”, there is still time to own volatility, but given where we are on the Vol Comet things can start to go very fast here. If we were to opine fundamentally on the difference between the buy-the-dip opportunity of late 2018 and the potential of this episode evolving into the full end-of-cycle risk unwind, we likely need look no further than the pesky Corona Virus issue. We have written extensively over the years on the build-up of risk through this cycle, specifically in terms of the unprecedented, and inevitably unsustainable, levels of debt taken on in the system. Most recently we touched on it again in our December 2019 monthly. So, as a simplified model of creditworthiness, one could pretty much collapse down to two things; cash flow and collateral. We have already seen from China the efforts to slow the spread of the virus by essentially shutting down large parts of the economy, with obvious implications on cash flow. It is not unrealistic to expect, as we have started to see in February, that if/when the virus continues to spread across the globe that impact on cash flow spreads with it. Now throw in a sudden shock to the value of various forms of collateral (stocks, bonds, commodities, property, etc), and you’ve got yourself a good old-fashioned credit crisis.
To make matters worse, the traditional tools, and a whole swath of untraditional ones, are already at all-time crazy accommodative extremes. Something we also touched upon in our December 2019 note. So, the usual cure of lowering borrowing costs to try to soften the blow to debt servicing in an economic turn, just really isn’t that much of an option. Though we have no doubt they will give their absolute best and craziest efforts.
Below is a nice view of the recent sort of history of the cycle. The previous market top occurred in Q3, 2007 and the subsequent sell-off was met with a series of aggressive Fed rate cuts, eventually taking Fed Funds from a starting point of 5.25% all the way to zero by the time the market bottomed some 18 months later in March, 2009. If we are about to embark on this cycle’s culmination and risk unwind, it isn’t hard to guess that they will once again get Fed Funds to 0% and probably a lot quicker than they did last time, what with a starting point of 1.75% this time.

Source: Bloomberg
If this is the beginning of the end-of-cycle unwind, should we equate what is happening right now to the Q3 2007 market top and initial funding issues? Or to the Q1 2008 Bear Stearns issues and eventual Fed bailout onto the books of JPM? Or to the terminal unwind in Q4 2008 on into Q1 2009 when the necessity to bailout all major global banks became deemed vital? Again, it is very hard to know, but we would certainly think overall, after such an unprecedentedly long cycle with so much extreme monetary policy measures throughout, that it is going to take quite some time to work the way through all the cleansing that will be required. We suspect that we shall soon see.
Our Cyclical/Seasonal indicator has had an extraordinarily long Fall, just like everything in this unique cycle. It has started to move sharply lower in February and could very easily be signalling a move back into a very complicated fire season. Be prepared.

Source: Bloomberg
Read our Disclaimer by clicking here